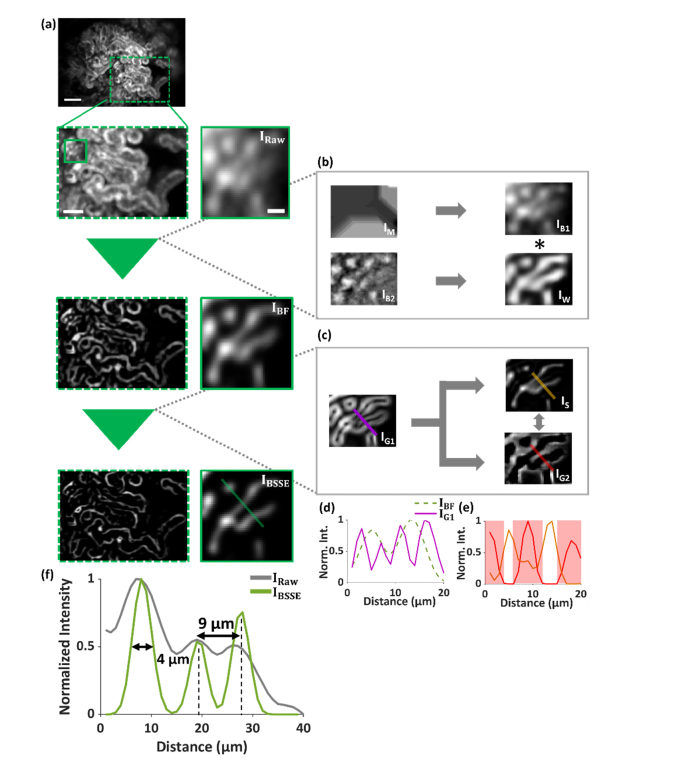
Fig. 8.
Illustration of the BSSE algorithm using beta-actin-EGFP mouse kidney tissue. (a-c) Architecture of the BSSE algorithm and BSSE-processed images of the kidney cortex of beta-actin-EGFP mice. As described in detail in Fig. 2, the results illustrate that the two main modules of the algorithm suppress the background (b) in the image IRaw, obtaining the image IBF, and enhance the signals (c), thus to obtain the final image IBSSE. (d) Cross-sectional profiles in the image IBF and its first-derivative image IG1 along the corresponding solid line in IG1. (e) Cross-sectional profiles along the solid color lines in IS and IG2, where IS represents the difference image between IBF and IG1, and IG2 is the second-derivative image of IBF. Concavity analysis is conducted to identify and segment the crossings of the overlapping signals (e.g. the shaded regions in (e)), obtaining the final image IBSSE. (f) Cross-sectional profiles in the images IRaw and IBSSE along the corresponding solid line in IBSSE. Scale bars: 100 µm (a, top row), 50 µm (a, left of the second row), 10 µm (a, right of the second row).

