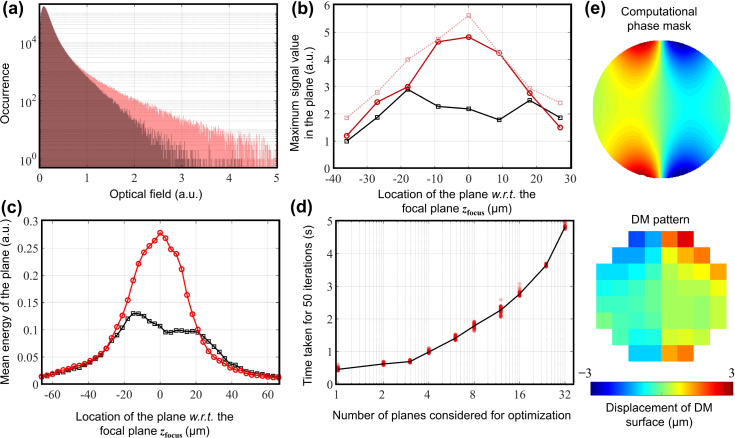
Fig. 5.
Analysis of volumetric aberration correction. (a) Histograms of the optical field for a 150-μm section before and after optimization (before correction with CAO) where the original signal occurrences are in dark red and the optimized signal occurrences are in light red. (b) The maximum signal magnitude at each pixel calculated for each of the en face images shown in Fig. 4. The black line corresponds to the aberrated image, the solid red line corresponds to the image corrected with AutoAO before correction with CAO, and the dotted red line corresponds to the metric after CAO. (c) Comparing the energy of the acquired signals before and after optimization. The black and red lines correspond to the original and optimized volumes, respectively. (d) Time taken for estimating the optimal phase correction mask when different number of depths are chosen for optimization. The solid line passes through the median value of 100 measurements. (e) Phase correction mask generated by AutoAO algorithm (top), corresponding pattern sent to the DM (bottom).

