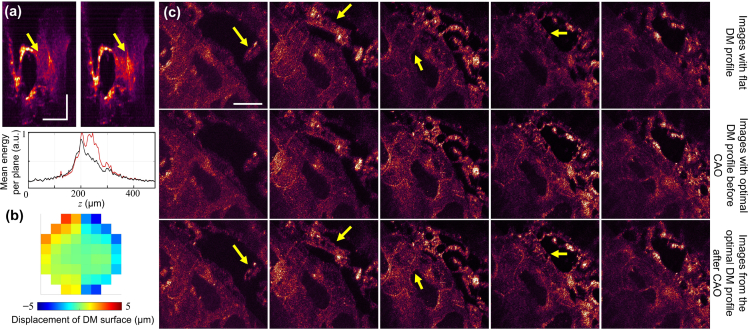
Fig. 6.
Volumetric aberration correction in a biological sample. (a) Cross-section OCM images (superposition of 10 slow-axis frames) of a tissue section from a salmon before (left) and after correction (right). The yellow arrows highlight the difference before and after correction with AutoAO. The plot below shows the mean energy per plane (for the entire 300 × 300 μm2 transverse region) before (red) and after (black) correction. Scale bars: 100 μm. (b) Pattern sent to the DM to achieve correction. (c) En face OCM images before correction (top), after correction (middle), and the corrected images post-CAO (bottom), each spaced 30 μm apart along the z-axis. The yellow arrows highlight the difference before and after correction with AutoAO, where the features are aberration free and have apparent increase in signal. Scale bar: 100 μm.

