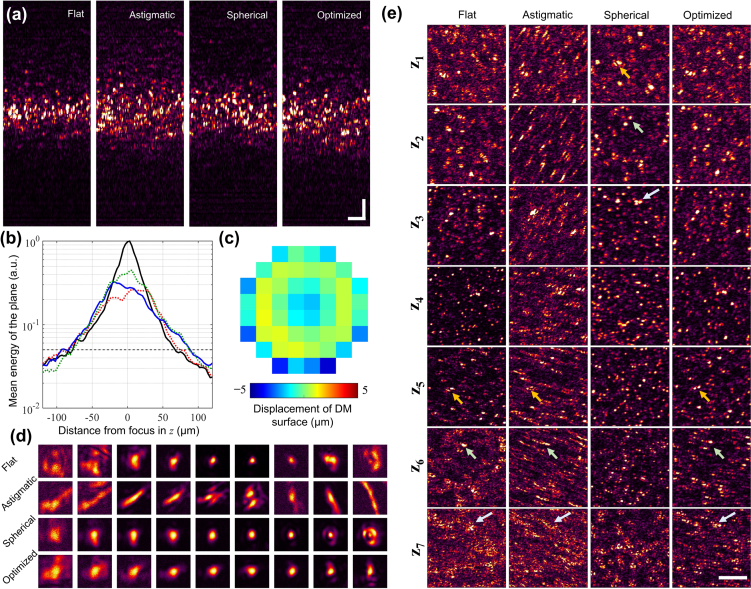
Fig. 7.
Extension of depth-of-focus. (a) Cross-section OCM images of the tissue mimicking phantom made of a translucent plastic sheet for different states of the DM. The color scales for each image are normalized to the maximum value in the plane. Scale bars: 20 μm. (b) Comparing the energy of the acquired signals for different aberration states on the DM. The black line corresponds to a flat DM profile, the red and green dotted lines correspond to astigmatic and spherically aberrated beams, respectively, and the blue solid line corresponds to the optimally aberrated profile generated by AutoAO. The gray dotted horizontal line corresponds to a 23 dB drop in the mean energy of the plane. From the intersection of this line to the four curves, the axial depth-of-fields from the graph for the flat, astigmatic, spherically aberrated, and the optimized beams are 144, 159, 168, and 177 μm, respectively. (c) The optimized pattern sent to the DM. (d) PSF measured at different aberration states shown at depths spaced 9 μm apart, measured on a silicone phantom with sparsely distributed iron-oxide nanoparticles. Each tile is 7.25 × 7.25 μm2. (e) En face OCM images for the flat, astigmatic, spherical, and optimized aberration profiles generated by the DM. Axial locations z1 to z7 are depths spaced 15 μm apart. The arrows point to notable features to help visually align the images in each column. Scale bar: 20 μm.

