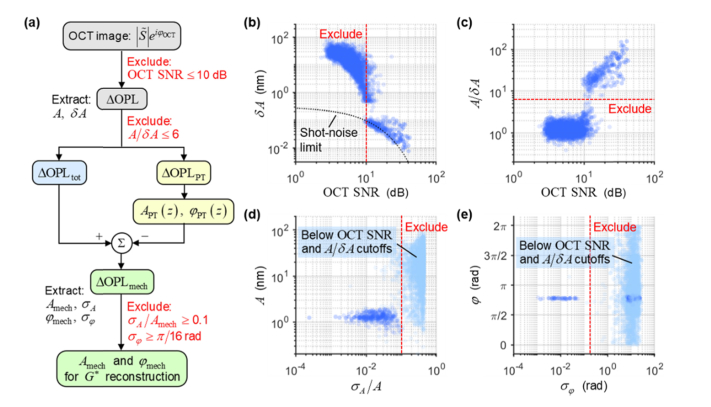
Fig. 3.
Noise analysis and exclusion criteria for quantitative PF-OCE. (a) Data processing flowchart with exclusion criteria at each step. (b) Noise amplitude, δA, in measured ΔOPL at all pixel depths in a PAM gel sample as a function of OCT SNR (in dB, plotted on a logarithmic scale). Black dotted curve indicates theoretical shot-noise limited noise floor [36]. (c) Oscillation amplitude-to-noise ratio, A/δA, as a function of OCT SNR. (d) Measured A as a function of metric for amplitude instability in time domain, σA/A. (e) Measured φ as a function of metric for phase instability in time domain, σφ. In (d) and (e), data points in light blue correspond to those that were excluded based on the criteria in (b) and (c). In (b)–(e), red dashed lines indicate the exclusion cutoffs.

