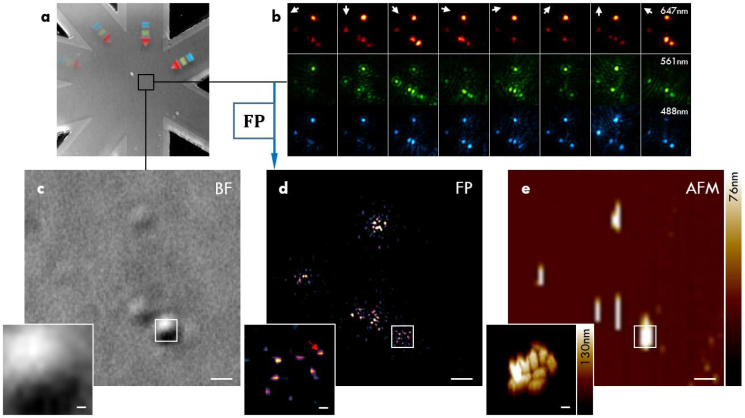
Fig. 4.
Imaging of metal-organic frameworks (MOFs) with FP. (a) Overview of the imaged region. (b) Raw evanescent scattering images under waveguide illumination with 488nm, 561nm, and 647nm laser light. (c) Brightfield image using sum of multiple LED wavelengths. (d) Intensity image created by Fourier ptychography. The red arrow in the inlay might be mistaken for individual particles but is most likely an image reconstruction artefact as its full width at half maximum (FWHM) is smaller then the theoretically achievable FWHM (∼ 50 nm versus ∼ 165 nm). (e) Atomic force microscopy image (line levelling artefacts prohibit a clear view of individual particles). Inlays show a zoomed region of a cluster of MOFs. The overview image (a) measures 100×100 μm2 and the scalebars in (c–e) are 1 μm and 100 nm in the inlays respectively.

