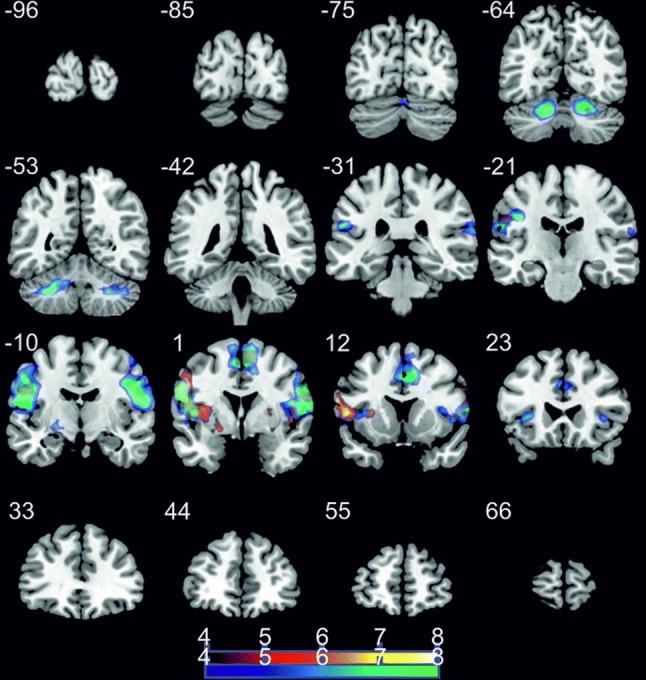
Fig. 3.

Coronal slices; t-score map for motor execution (cold colors) and motor imagery offline (hot colors) compared to rest; p < 0.05 corrected for multiple comparisons on cluster-level [false discovery rate (FDR)]; minimum cluster size 20 voxels; numbers next to the slices indicate the y coordinates of each slice
