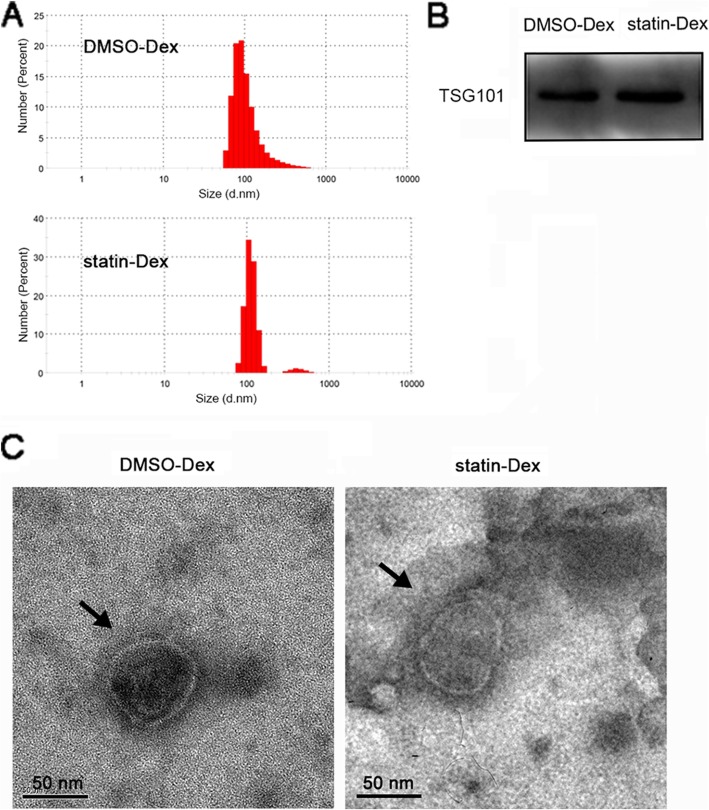
Fig. 1.
Characterization of DMSO-Dex and statin-Dex. a DLS Nano sizer analysis showed size distribution of exosomes from the DMSO-Dex and the statin-Dex groups, ranging from 70 to 140 nm (mainly from 80 to 120 nm). b TSG101 expression with size 49 kDa in DMSO-Dex and statin-Dex. c Representative images of the exosome from the DMSO-Dex and the statin-Dex groups under transmission electron microscopy (scale bar 50 nm)

