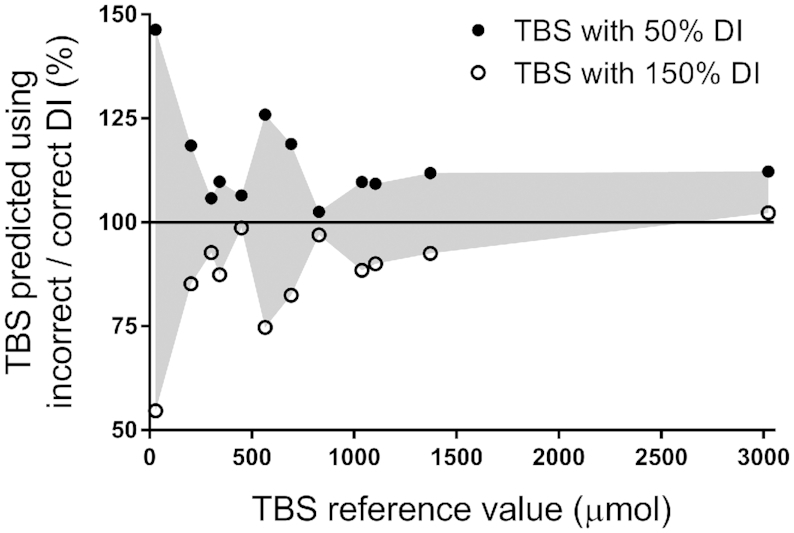
FIGURE 4.

Impact of using values above or below the reference intake on model-predicted TBS for 12 theoretical human subjects. Shown are ratios of TBS predicted when dietary vitamin A intake was set at 50% or 150% of the reference value (“incorrect”) to TBS predicted using the (“correct”) reference value compared with each subject's reference value for TBS. The solid line indicates a ratio of 1. See also Supplemental Table 3. DI, dietary intake; TBS, total body stores.
