Figure 2.

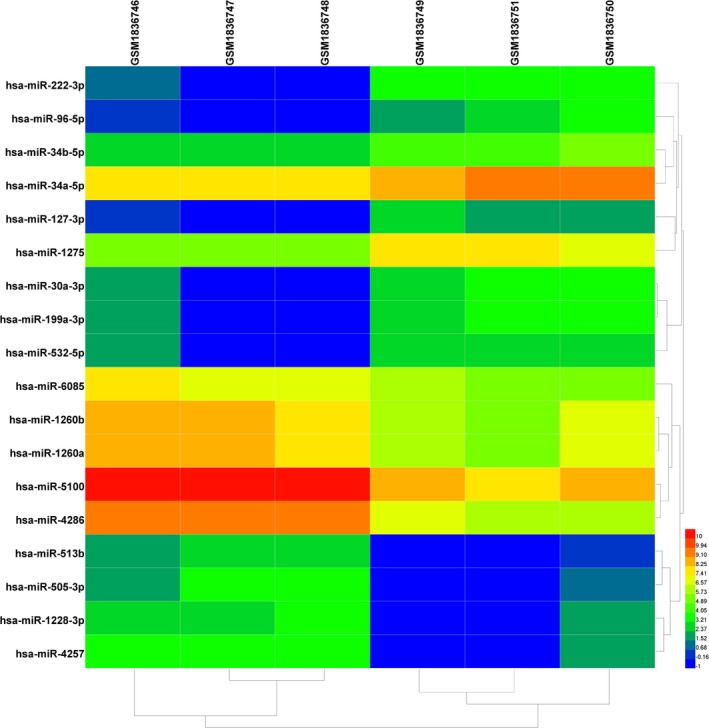
Heat map of differentially expressed miRNAs. Changes in p < .05 and |log2 fold‐change| ≥ 1.5 are illustrated by a heat map. miRNAs, microRNAs

Heat map of differentially expressed miRNAs. Changes in p < .05 and |log2 fold‐change| ≥ 1.5 are illustrated by a heat map. miRNAs, microRNAs