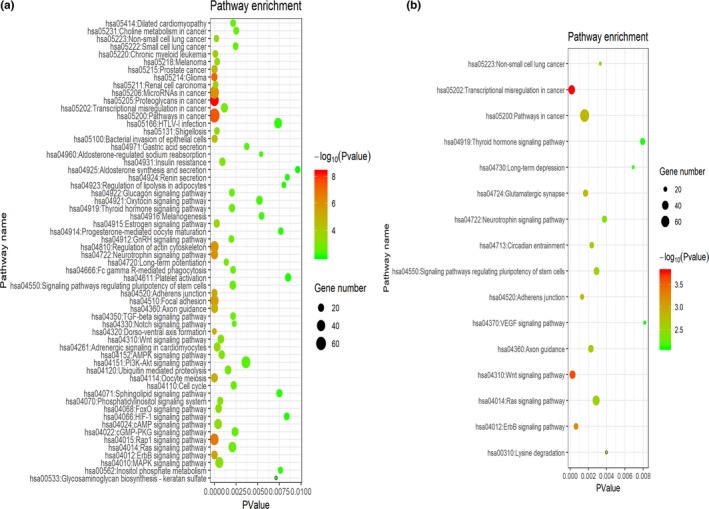
Figure 3.

Bubble chart of KEGG pathway enrichment analyses for (a) Upregulated DEMs and (b) downregulated DEMs. Different bubble color represents p value. Red indicates strong significance. Bubble size indicates gene numbers enriched in pathway. DEMs, differentially expressed microRNAs; KEGG, Kyoto Encyclopedia of Genes and Genomes
