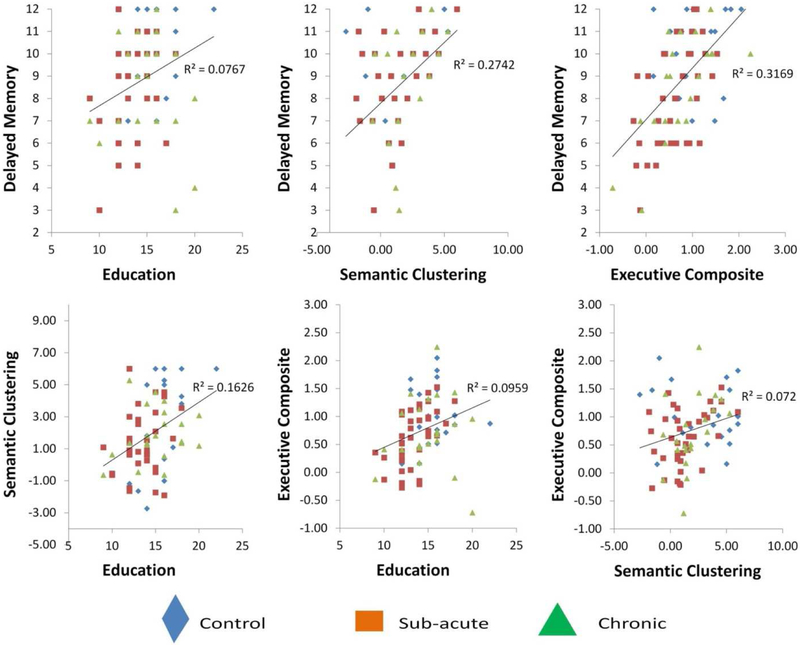
Figure 1.
Scatterplots for key relationships among variables in the study (Total correct on Trial 4, the delayed memory trial, predicted by education, executive function, and semantic clustering (upper row), and inter-relationships among these predictors (lower row). Individuals in control, sub-acute TBI, and chronic TBI groups are represented separately (see legend).

