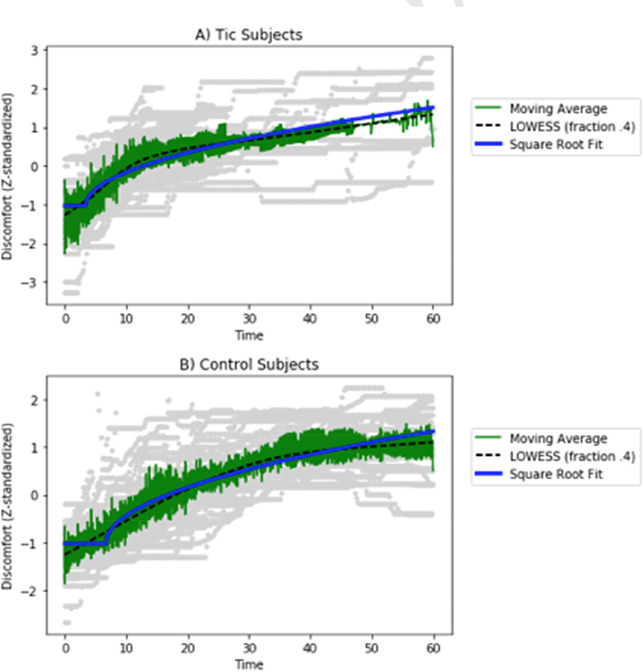
Figure A.3. Discomfort during successful blink suppression.
Discomfort is plotted across all blink suppression trials, beginning at the start of each “don’t blink” trial and extending to the first blink. The functional form was fit to the data and compared to a LOWESS (locally weighted scatterplot smoothing) fit to the data. Individual subject data is plotted in gray, while the mean is shown in green and LOWESS in black. (A) Data from tic subjects; (B) data from control subjects.

