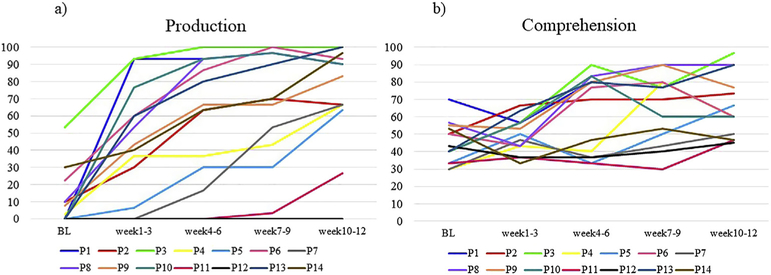
Fig. 3 –
Individual acquisition curves derived from the weekly probe tasks for a) production and b) comprehension of the trained items. Lines display the percentage of correct responses at BL (average of multiple baseline assessments) and at 4 time points over the course of treatment (i.e., every three weeks), for each participant.

