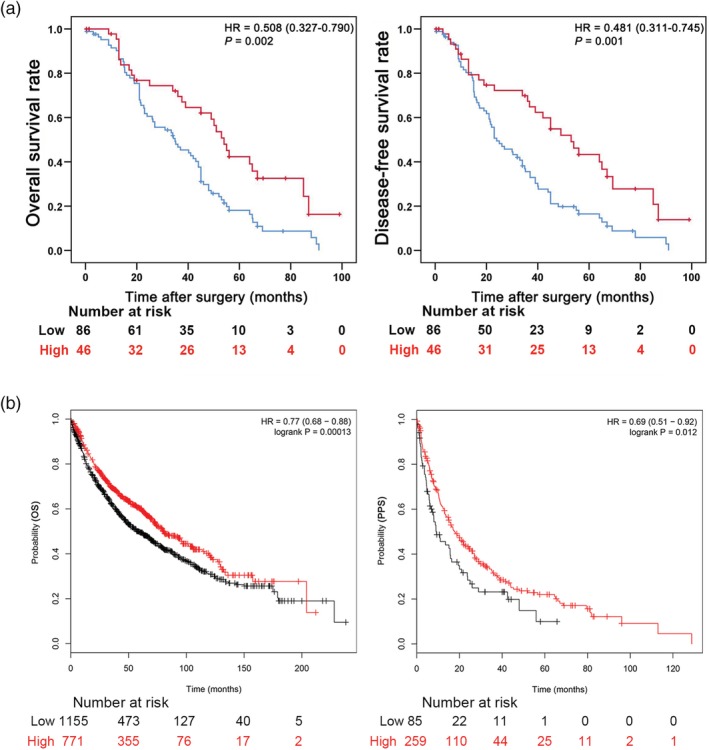
Figure 3.

High PHLPP2 expression correlated with favorable survival outcomes in NSCLC patients. (a) Kaplan‐Meier analysis of overall (left) and disease‐free survival (right) for high and low PHLPP2 expression levels. ( ) Low‐PHLPP2 and (
 ) high‐PHLPP2. (b) Kaplan‐Meier survival curves of OS and PPS comparing high and low PHLPP2 expression estimates of NSCLC patient survival probability determined from the Kaplan‐Meier plotter database (213407_at). Expression (
 ) low and (
 ) high. * P < 0.05 was considered statistically significant.
