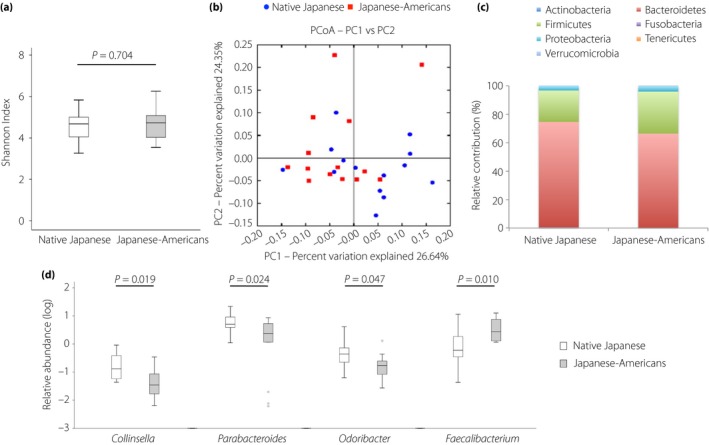
Figure 2.

Difference in the gut microbiota compositions between the native Japanese and Japanese‐American men. (a) Alpha diversity as assessed by the Shannon Index for the fecal microbiota between the native Japanese and Japanese‐American men. (b) Principal coordinates analysis (PCoA) based on the weighted UniFrac distances for the fecal microbiota between the native Japanese and Japanese‐American men. (c) Relative abundance of phyla in fecal samples between the native Japanese and Japanese‐American men. (d) Relative abundance of genus in fecal samples between the native Japanese and Japanese‐American men. Data are presented as the mean ± standard deviation. The line in the middle of the box indicates the median value; the box extends from the 25th–75th percentiles.
