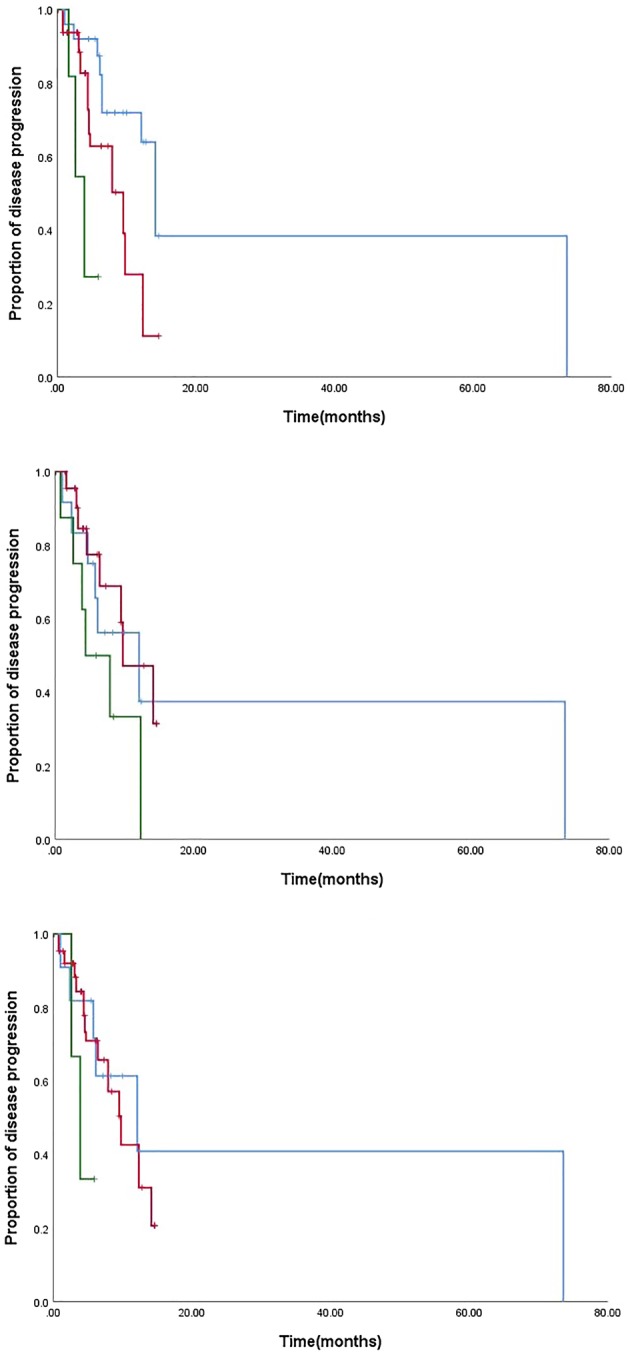
Figure 2.

Correlation with ABCB1 and PFS of chemotherapy in paclitaxel treatment group. (a) PFS analysis in ABCB1(3435T>C) locus ( ) CC, (
 ) TC, and (
 ) TT; (
 ) CC, (
 ) TC, and (
 ) TT; (b) PFS analysis in ABCB1 2677 G>T/A locus (
 ) GG, (
 ) TG, and (
 ) TT; (
 ) GG, (
 ) TG, and (
 ) TT; (c) PFS analysis in ABCB1 diplotype (
 ) GCGC, (
 ) others, (
 ) TTTT, (
 ) GCGC, (
 ) others, (
 ) TTTT.
