
Figure 5.
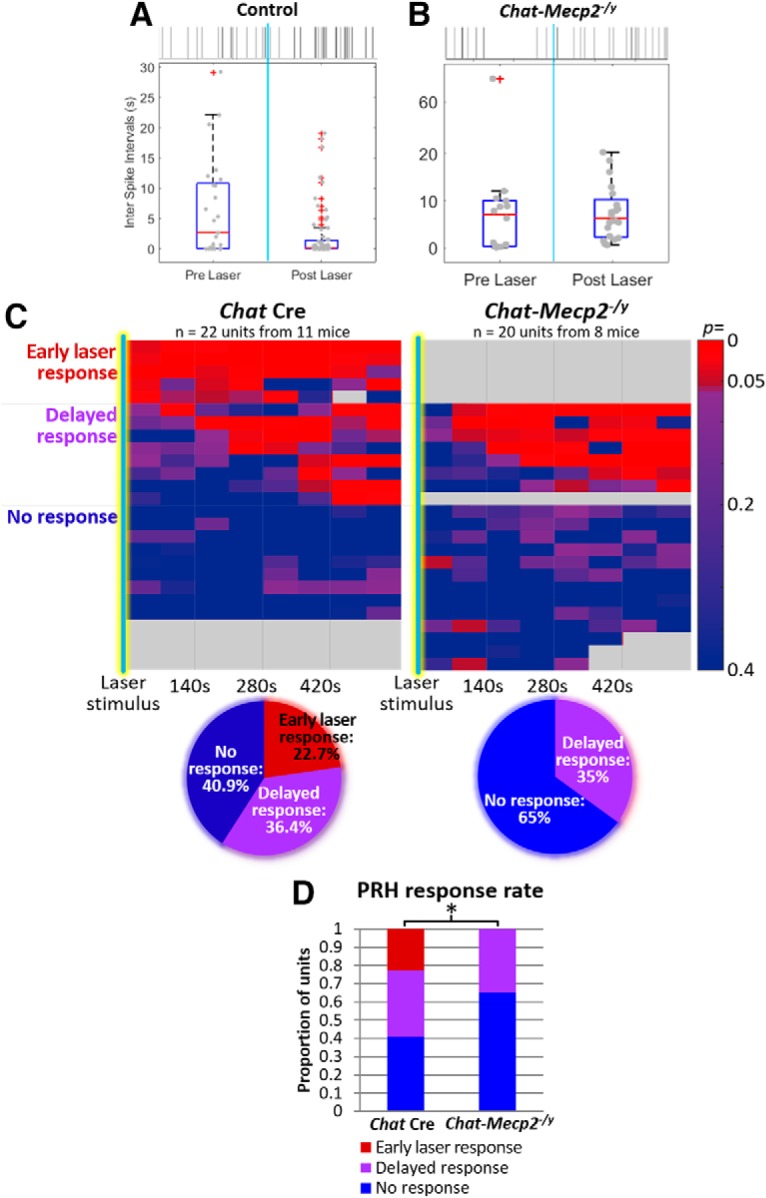
PRH response to the stimulation of endogenous cholinergic signaling is impaired in Chat-Mecp2-/y mice. A, B, Representative data from a PRH unit in a control mouse exhibiting a response to stimulation of cholinergic input (A) and a PRH unit from an Chat-Mecp2-/y mouse (B). Top, Representative raster plot of spikes. Vertical light blue bar indicates timing of optical stimulation. Bottom, Box plot of interspike intervals. C, Heat map of p values as a function of time since optical stimulation for PRH units from control mice (left) and from Chat-Mecp2-/y mice (right). Responses either occurred in the first time period following laser stimulation or were delayed. Each row represents a separate unit. The results are summarized in pie charts at bottom. D, Summary of differing response rates between control and Chat-Mecp2-/y units (χ2 test for homogeneity: CR(2) = 6.02; p = 0.049). *p ≤ 0.05.