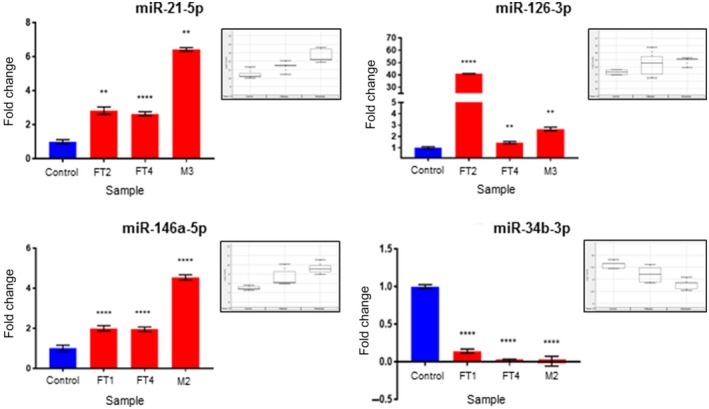
Figure 2.

qPCR validation studies showing expression fold changes of miR‐21, miR‐126‐3p, miR‐146a, and miR‐34b‐3p in doxycycline‐induced fallopian tubes (FT2, FT4) and metastatic samples (M2 and M3) when compared to Controls. Statistical significance was calculated by using an unpaired t test with Welch's correction (**** and ** indicate P <.0001 and <.005, respectively). The box plots in the insets show miR‐21a‐5p, miR‐126a‐3p, miR‐146a‐5p, and miR‐34b‐3p expression in tissue samples as determined by the NanoString analysis
