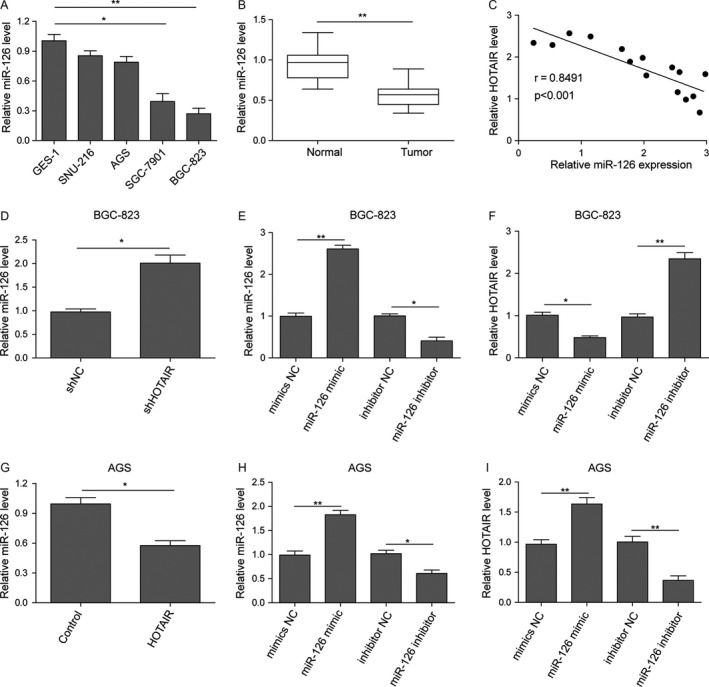
Figure 4.

HOTAIR expression negatively correlated with miR‐126. (A) Quantified mRNA level in normal or tumor gastric cell lines. Data are means ± SEM.*P < 0.05, **P < 0.01. (B) qRT‐PCR. Levels of miRNA were assayed using qRT‐PCR in gastric cancer and the paired normal tissues. (C) The Spearman correlation analysis of miR‐126 and HOTAIR (D) qRT‐PCR. BGC‐823 cells were transfected with shHOTAIR or shNC and then subjected to qRT‐PCR analysis of miR‐126 levels. (E) qRT‐PCR. BGC‐823 cells were transfected with plasmid of miR‐126 mimics (mimic NC) or miR‐126 mimics or plasmid of miR‐126 inhibitor (inhibitor NC) or miR‐126 inhibitor, and then subjected to qRT‐PCR analysis of miR‐126 levels. (F) qRT‐PCR. BGC‐823 cells were transfected with plasmid of mimic NC or miR‐126 mimics or inhibitor NC or miR‐126 inhibitor and then subjected to qRT‐PCR analysis of HOTAIR levels. (G) qRT‐PCR. AGS cells were transfected with pc‐control or pc‐HOTAIR and then subjected to qRT‐PCR analysis of miR‐126 levels. (H) qRT‐PCR. AGS cells were transfected with plasmid of mimic NC or miR‐126 mimics or inhibitor NC or miR‐126 inhibitor, and then subjected to qRT‐PCR analysis of miR‐126 levels. (I) qRT‐PCR. AGS cells were transfected with plasmid of mimic NC or miR‐126 mimics or inhibitor NC or miR‐126 inhibitor and then subjected to qRT‐PCR analysis of HOTAIR levels. Data are means ± SEM.*P < 0.05, **P < 0.01.
