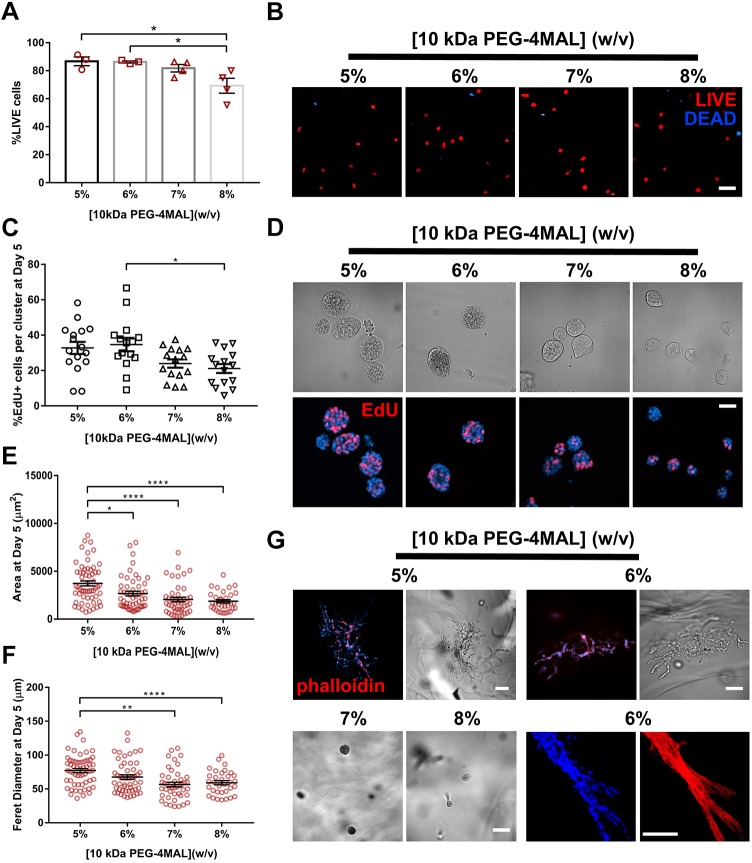
Fig. 2.
Polymer density of 10 kDa PEG-4MAL directs tubule formation. (A) Percentage of IMCD cells that stained for LIVE (C12-Resazurin) after 1 day of encapsulation in 10 kDa PEG-4MAL hydrogels of different polymer density (mean±s.e.m.). Each data point represents one hydrogel sample. At least 100 cells were assessed per condition. (B) Fluorescence microscopy images of IMCD cells cultured in PEG-4MAL hydrogels of different polymer density. IMCD cell viability was assessed at 1 day after encapsulation. Scale bar: 100 μm. (C) Percentage of IMCD cells per cluster that were labeled by EdU incorporation (mean±s.e.m.) after 5 days of encapsulation. At least 30 clusters were analyzed per condition. (D) Transmitted light and fluorescence microscopy images of proliferating (EdU+) IMCD cells cultured in PEG-4MAL hydrogels of different polymer density. IMCD cell proliferation was assessed at 5 days after encapsulation. Scale bar: 50 μm. IMCD multicellular structure (E) projected area and (F) Feret diameter at 5 days after encapsulation in PEG-4MAL hydrogel. Graph line represents the mean of the individual data points. Each data point represents one multicellular structure. (G) Transmitted light and fluorescence microscopy images of IMCD cells at 21 days after encapsulation in PEG-4MAL hydrogel and labeled for actin (phalloidin). DAPI was used as a counterstain. Scale bars: 100 μm. ****P<0.0001, **P<0.001, *P<0.0332 (Kruskal–Wallis with Dunn's multiple comparisons test). Experiments performed with six PEG-4MAL hydrogels per experimental group. Three independent experiments were performed and data are presented for one of the experiments.

