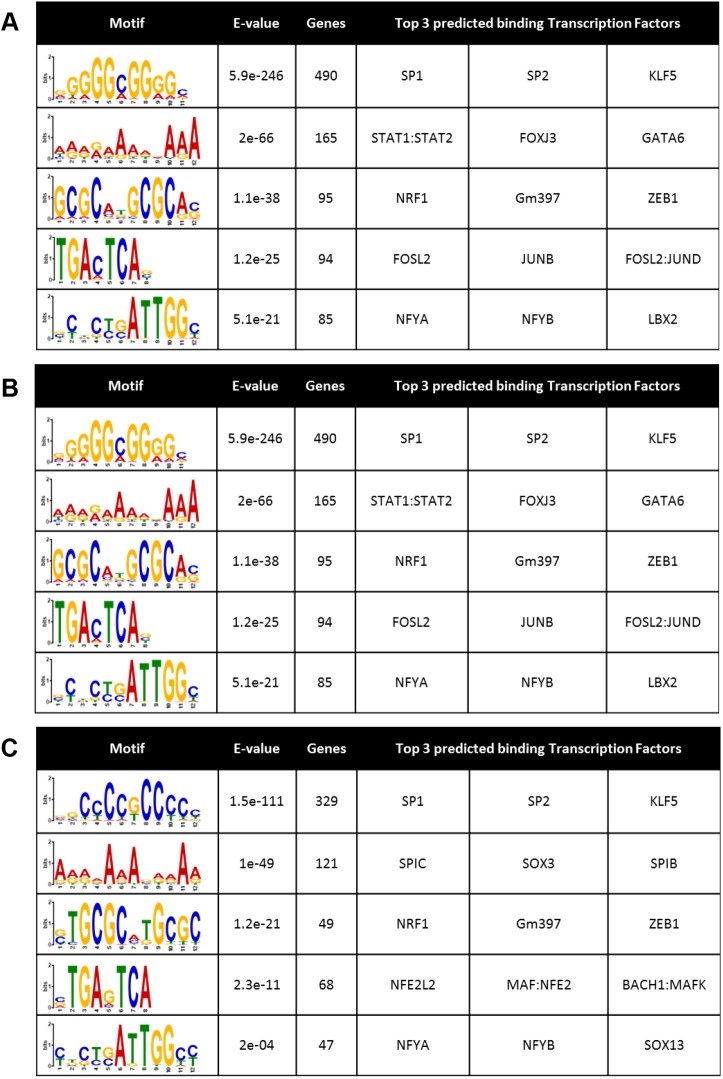
Fig. 7.
TF motif enrichment analysis. (A) TF motifs enriched in the promoter region of genes repressed by TGFβ identified via RNA sequencing analysis represented by a sequence logo diagram where the size of the letter represent the frequency at which each nucleotide occurs. (B) TF motifs enriched in the promoter region of genes repressed by TGFβ and rescued by HDAC inhibition. (C) TF motifs enriched in the promoter region of genes repressed by TGFβ and not rescued by HDAC inhibition. The E-value is a statistical measure to describe the likelihood of finding a motif within random background genomic sequences.

