Fig. 1.
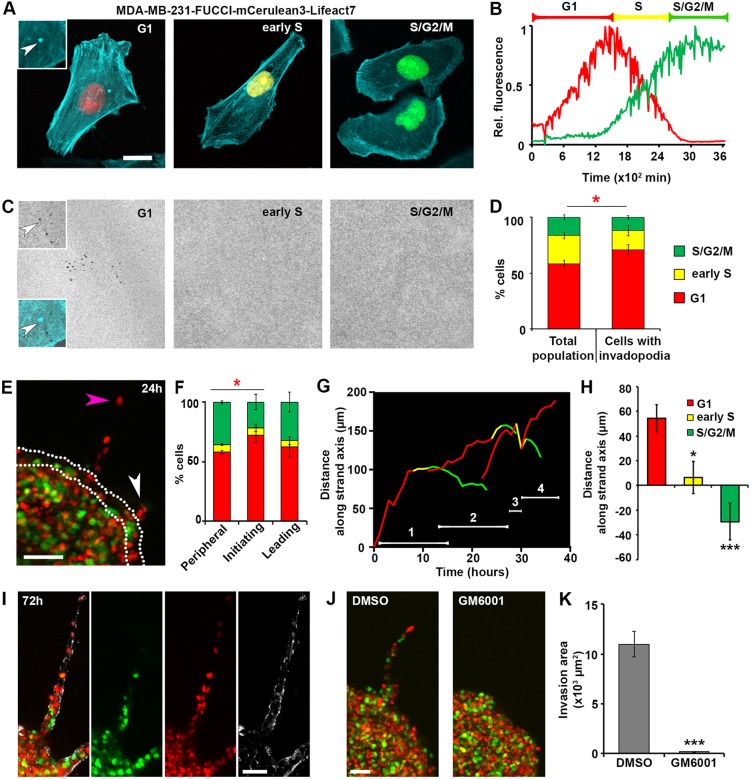
ECM degradation by invadopodia is enriched in the G1 phase of the cell cycle. (A) Representative images of MDA-MB-231 cells expressing FUCCI cell cycle reporters and the F-actin marker mCerulean3–Lifeact7 in G1, early S (middle) and S/G2/M (right) phases. Note the actin-enriched punctum in G1 cell (arrowhead, inset 1.5× magnification compared to main image). Scale bar: 10 µm. (B) Representative traces of red and green fluorescent signals in an MDA-MB-231-FUCCI cell monitored over time. Brackets indicate how the cell cycle phases are classified based on the fluorescence signal: early S phase corresponds to the period where red fluorescence has a negative slope. The ratio of the mean to maximum gray values is presented. (C) Representative images of a gelatin layer of cells in as in A during a 2D degradation assay. Note mature invadopodia in G1, where gelatin holes colocalize with actin enriched-punctum (arrow; see top inset for gelatin and bottom inset for overlay). (D) Percentage of cells in each phase of the cell cycle, either in total cell population, or in cells with invadopodia. Counts are based on 435 cells from three biological replicates. The red asterisk represents the comparison of percentage of cells in G1. Means±s.e.m. are shown. *P<0.05 (Mann–Whitney U-test). See Movies 1 and 2. (E) Representative image of a 3D spheroid at 24 h after embedding in high-density collagen I (5 mg/ml). Cells initiating and leading the invasive strands are marked by white and magenta arrowheads, respectively. Peripheral cells are marked by the white dashed outline. Scale bar: 100 µm. See Movie 3. (F) Percentage of cells in each phase of the cell cycle, either located in the periphery of the spheroid, or initiating or leading strand invasion (n=70 invasion strands, 20 spheroids, three biological replicates). Leader cells were evaluated at 70 h after embedding. The red asterisk represents the comparison of percentage of cells in G1. Mean±s.e.m. are shown. *P<0.05 (Mann–Whitney U-test). (G) Tracks of four consecutive leader cells along the strand axis, over time (Movie 4, Fig. S2). The red portion of each line corresponds to G1 phase, yellow to early S phase and green to late S/G2/M. The time period during which a cell was the leader is marked by white numbered line. (H) Quantification of the distance traveled by leader cells in G1 (red), early S (yellow) and late S/G2/M (green). The positive values indicate distance covered in the direction of the strand invasion (i.e. away from the spheroid core), while the negative values indicate backward movement, towards the spheroid core. Means±s.e.m. are shown. *P<0.05, ***P<0.001 (Mann–Whitney U-test). (I) Representative image of an invasive strand in a 3D spheroid at 72 h after embedding in high-density collagen (5 mg/ml) merged (left) and individual channels showing FUCCI nuclei (red, green) and cleaved collagen (Col1-¾C antibody, white). Scale bar: 50 µm. (J) Representative images and (K) quantification of the invasion area in DMSO control (n=25) and 25 µM GM6001-treated (n=17) spheroids from three biological replicates, taken at 72 h after embedding. Means±s.e.m. are shown. ***P<0.001 (Mann–Whitney U-test).

