Fig. 2.
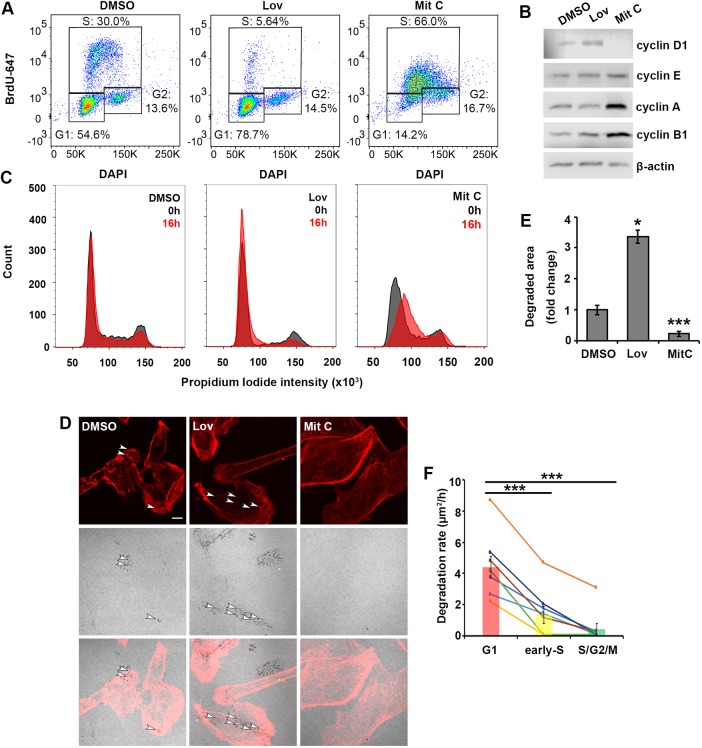
Rate of ECM degradation decreases as cells progress from G1 to S and G2 phases. (A) BrdU–DAPI plots of DMSO-treated control cells, cells synchronized in G1 with lovastatin (Lov, 10 µM) treatment and cells synchronized in S phase with mitomycin C (Mit C, 1 µg/ml) treatment. The cells were harvested after a 24 h treatment. The percentage of cells in each phase of the cell cycle is indicated. (B) Western blot analysis of cells treated with DMSO control, lovastatin (Lov, 10 µM) and mitomycin C (Mit C, 1 µg/ml) for 24 h and blotted for cyclin D1, cyclin E, cyclin A and cyclin B1. β-actin is used as a loading control. (C) Histograms of PI staining of cells released (0 h, gray; 16 h, red) from synchronization by treatments with DMSO control, lovastatin (Lov, 10 µM) and mitomycin C (Mit C, 1 µg/ml). The cells were pre-treated with the indicated drugs for 24 h. (D) Representative images of ECM degradation and phalloidin-labeled cells after 16 h, for cells treated with DMSO (control) or released from Lov and Mit C treatments. Top panels show actin (red), middle panels show gelatin, and bottom panels show overlay images. White arrowheads point to mature invadopodia. Scale bar: 10 µm. (E) Quantification of the degraded area per cell represented as fold change relative to DMSO control. The mean±s.e.m. of the degraded area per field of view (FOV) is shown; >100 cells, NFOV=30 and three biological repeats per treatment. *P<0.05, ***P<0.001 (t-test). (F) The degradation rates of cells decrease as cells progress from G1 to early S and S/G2/M. See Movie 5. Each line represents an individual cell. Bars represent the mean degradation rate per cell cycle phase. ***P<0.001 (for the mean degradation rate; Mann–Whitney U-test). In addition, to determine the statistical significance of the degradation rate trends, we fit the data to repeated measures model and performed repeated measures analysis of variance in Matlab (Mathworks, Natick, MA). We obtained a P-value of 1.1×10⁻³, indicating there is a significant decreasing trend of degradation rate as the cell progresses through the cell cycle.

