Fig. 3.
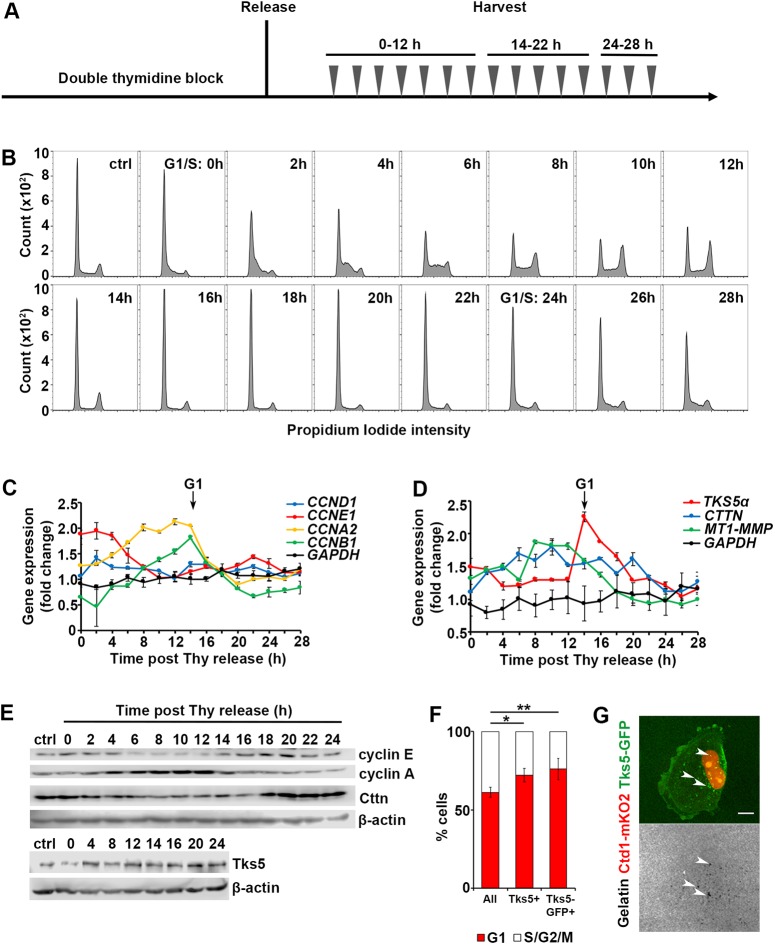
The key components of invadopodia are cell cycle regulated. (A) The schematic of the double-thymidine block, release and harvest regimen. The cells are synchronized at the G1/S boundary with a double-thymidine block; cells are released and harvested every 2 hs over 28 h, in two batches: time points 0–12 h and 24–28 h were collected in batch 1, and 14–22 h in batch 2. (B) Histograms of PI staining of cells harvested at 0–28 h. G1/S transitions are marked at time 0 h and 24 h. (C) Expression levels of genes encoding for cyclins as measured by qRT-PCR. The data were normalized to the reference gene GAPDH (black lines), and presented as fold change relative to that in the asynchronously cycling population. Entry to G1 is marked by arrow (14 h). (D) Expression levels of genes encoding for invadopodia components measured by qRT-PCR. The data were normalized to the reference gene GAPDH (black lines), and presented as fold change relative to that in the asynchronously cycling population. Entry to G1 is marked by the arrow (14 h). (E) Protein expression levels of cyclins and invadopodia components as assessed by western blotting; β-actin is used as loading control. (F) Quantification of the percentage of cells in G1 versus S/G2/M in the total cell population, in cells assembling endogenous Tks5+ invadopodia and Tks5–GFP+ invadopodia (overexpression). The mean±s.e.m. number of cells per field of view (FOV) is shown; >100 cells, NFOV=15. *P=0.01539, **P=0.00326 (Mann–Whitney U-test). (G) Representative image of a G1 cell assembling Tks5–GFP+ invadopodia and the underlying degraded gelatin (white arrowheads). Scale bar: 10 µm.

