Fig. 4.
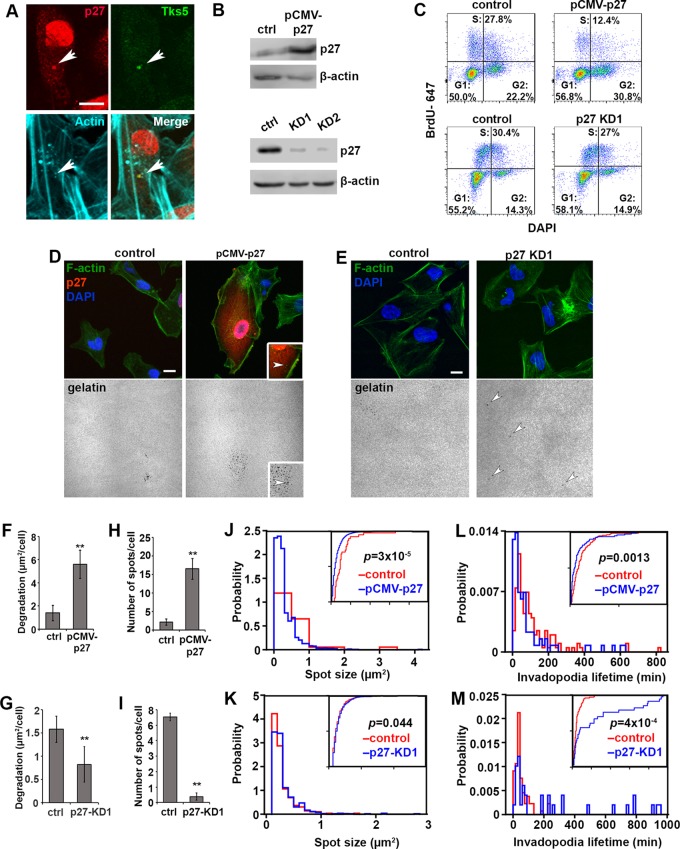
Cyclin-dependent kinase inhibitor p27kip1 localizes to invadopodia and regulates invadopodia dynamics. (A) Representative image of endogenous p27kip1 (red), Tks5 (green) and actin (cyan) in MDA-MB-231 cells. Colocalization of puncta is marked with white arrows. Scale bar: 10 µm. (B) Western blot analysis of the vector control, overexpression (pCMV-p27) and two different knockdown lines (p27-KD) of p27kip1. β-actin is used as a loading control. (C) BrdU/DAPI flow cytometric analysis of cell cycle profiles of pCMV-p27 or p27kip1 (p27)-KD1 cells and their corresponding controls. The areas show the percentage of cells in each cell cycle phase. (D) Representative immunofluorescence images of vector control and p27kip1-overexpressing cells with labeled nuclei (DAPI, blue), actin (phalloidin, green), p27kip1 (red) and gelatin (gray). Insets are a magnified area of a p27kip1-overexpressing cell. The white arrowhead points at the colocalization of actin, p27kip1 and the underlying degradation spot, indicating a mature invadopodium. Scale bar: 10 µm. (E) Representative immunofluorescence images of control and p27-KD1 cells with labeled nuclei (DAPI, blue), actin cytoskeleton (phalloidin, green) and gelatin (gray). White arrowheads point to degraded spots. Scale bar: 10 µm. (F) Quantification of the degraded area per cell in control and p27-overexpressing cells (pCMV-p27). (G) Quantification of the degraded area per cell in control and p27-KD1 cells. (H) Quantification of the number of degradation spots per cell in control and p27kip1-overexpressing cells (pCMV-p27). (I) Quantification of the number of degradation spots per cell in control and p27-KD1 cells. (J) Distribution of the degradation spot size values in control (red) and cells overexpressing p27kip1 (pCMV-p27, blue), P=3×10⁻⁵. (K) Distribution of the degradation spot size values in control (red) and p27-KD1 (blue) cells, P=0.044. (L) Distribution of the invadopodia lifetime values measured from control (red) or p27kip1-over-expressing cells (pCMV-p27, blue), P=0.0013. (M) Distribution of the invadopodia lifetime values measured from control (red) or p27-KD1 (blue), P=4×10⁻⁴. For each bar or distribution presented in F–M, >60 cells were analyzed in multiple biological replicates. For F–I, the means±s.e.m. per field of view (FOV) from three biological replicates are presented. **P<0.01, ***P<0.001 (Mann–Whitney U-test). For J–M, cumulative distribution function plots are included as insets and Kolmogorov–Smirnov tests were performed to determine the statistical significance of the difference between two distributions.

