Fig. 5.
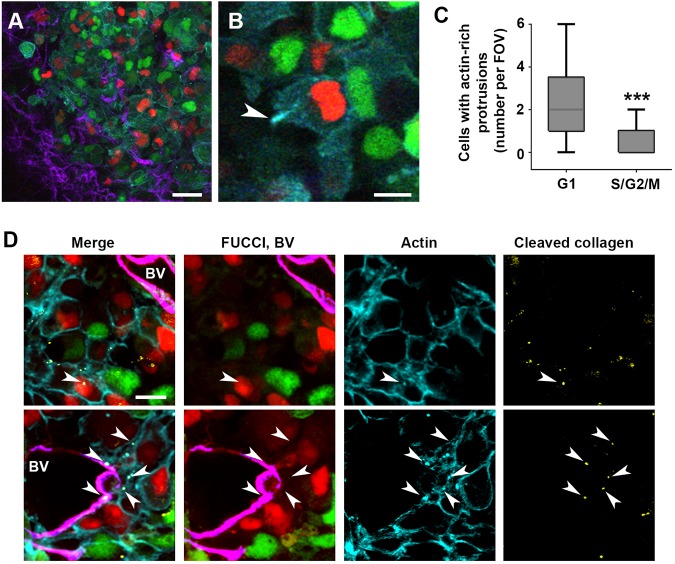
Invadopodia are enriched in G1 cells in vivo. (A) Intravital image of MDA-MB-231-FUCCI-Lifeact7-mCerulean3 mouse xenograft. Cells in G1 (red nuclei), and S/G2/M (green nuclei) are shown, with actin cytoskeleton in cyan and collagen fibers in purple. Scale bar: 50 µm. (B) Zoom-in on a cell in G1 phase (red nucleus) extending an actin-rich protrusion (arrowhead). Also see Movie 6. Scale bar: 10 µm. (C) Quantification of cells with actin-rich protrusions per field of view, grouped per phase of the cell cycle. >50 cells with actin-rich protrusions from 12 fields of view in three mice were analyzed. The box represents the 25–75th percentiles, and the median is indicated. The whiskers show the minimum and maximum values. ***P<0.001 (Mann–Whitney U-test). (D) Immunofluorescence images of cryosections from two different tumors, showing cells in G1 (red nuclei), cells in S/G2/M (green nuclei), the actin cytoskeleton (cyan), blood vessels (BV, magenta) and cleaved collagen I (Col1-C¾ antibody, yellow). Also see Movie 7. White arrowheads indicate mature invadopodia defined as actin puncta that colocalize with degraded/cleaved collagen. Scale bar: 20 µm.

