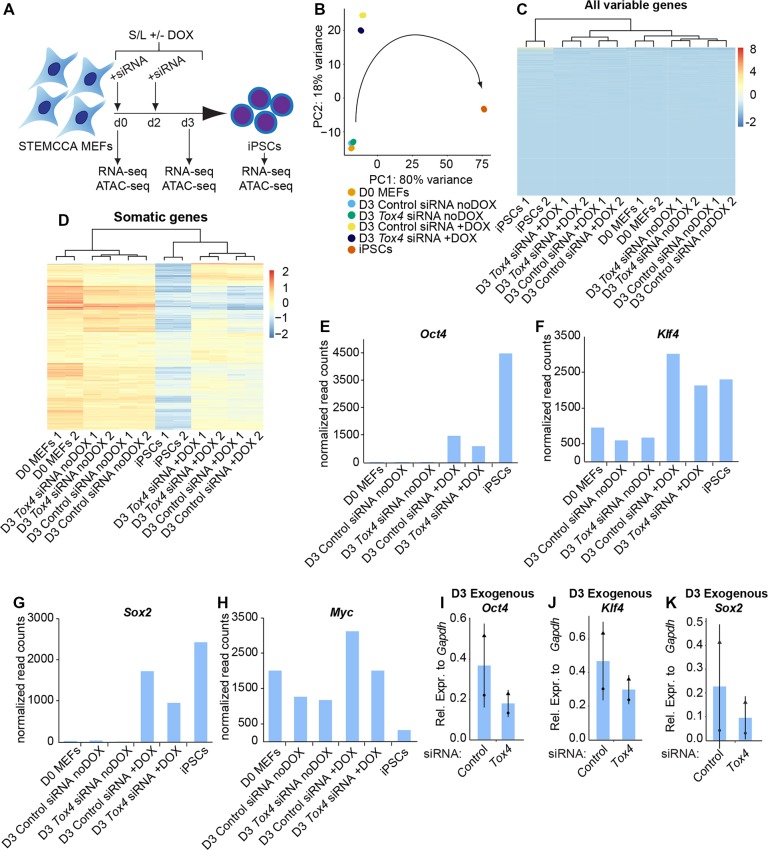
Fig. 4.
Tox4 suppression prolongs the expression of selected somatic genes early during reprogramming. (A) Scheme of Tox4 knockdown during reprogramming to iPSC in S/L with and without DOX. Samples for RNA-seq and ATAC-seq were collected at D0 and D3 of reprogramming. In parallel, iPSCs without siRNA treatment were collected after 12 days of DOX induction and were included as a control. (B) PCA of the 500 most variable genes across all samples. Each point represents a single sample and is labeled according to sample name. Data were plotted along the first and second principal components. The arrow indicates the trajectory of the reprogramming time course. (C) Unsupervised hierarchical clustering of all variable genes across all samples. Normalized gene expression was plotted on a high-to-low scale (red–blue). (D) Unsupervised hierarchical clustering of somatic genes across all samples suggesting that the expression of a subset of somatic genes is elevated in Tox4 siRNA-treated cells. Somatic genes were defined as the top 500 genes that were significantly (P<0.05) more highly expressed in D0 MEFs compared to iPSCs in this dataset. Normalized gene expression was plotted on a high-to-low scale (red–blue). (E–H) Normalized read counts of Oct4 (E), Klf4 (F), Sox2 (G) and Myc (H) in early reprogramming to iPSCs. Results are shown as the mean of technical duplicates (n=1). (I–K) Exogenous Oct4 (I), Klf4 (J) and Sox2 (K) transcript level after 3 days of STEMCCA MEFs reprogramming and transfection of Tox4 or control siRNAs every 2 days. Results are shown as the normalized mean±s.d. relative to the expression of Gapdh (arbitrary units) (n=2 with biological duplicates in total). Squares, triangles and circles represent one independent experiment each.

