Fig. 2.
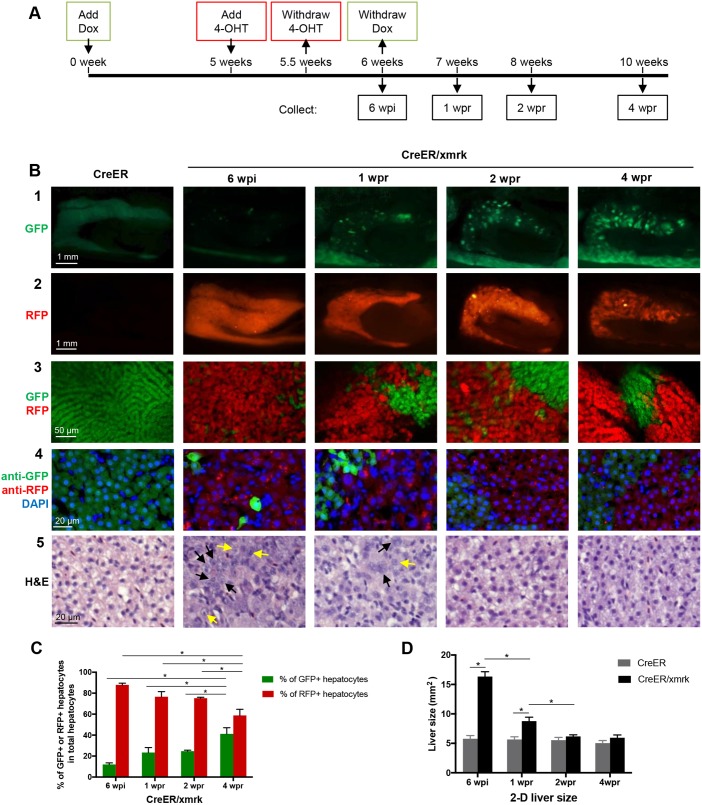
Tracing liver tumor cells during tumor regression in adult fish. (A) Flowchart of fish treatment and sample collection. CreER and CreER/xmrk adult fish (4 mpf) were treated with Dox for 6 weeks to induce HCC. 4-OHT was added at 5 wpi (weeks post-induction) for 3 days to cause loxP recombination for marking the tumor cell lineage with RFP expression. Fish were collected at 6 wpi, 1 wpr (weeks post-regression), 2 wpr and 4 wpr for various assays. (B) Fluorescent protein expression and histological analyses of livers. Rows 1 and 2 are representative images of gross observation of GFP and RFP in the livers under a stereomicroscope. Row 3 shows representative confocal images of the fresh liver tissue immersed in phosphate buffer to show the re-establishment of the two-cell hepatic plate structure from tumor-reverted hepatocytes during tumor regression. Row 4 shows representative images of fixed liver sections for GFP expression, RFP expression (stained with anti-RFP antibody) and nuclear staining by DAPI for quantification of cell number. Row 5 shows representative images of H&E staining. Black arrows, large and irregular nuclei; yellow arrows, prominent nucleoli. (C) Quantification of percentages of GFP+ hepatocytes and RFP+ hepatocytes in total hepatocytes based on liver sections from panel B row 3 (n=10). (D) Quantification of 2D liver size based on the left lateral view of dissected fish as shown in row 2 of panel B (n=10/group). *P<0.05.

