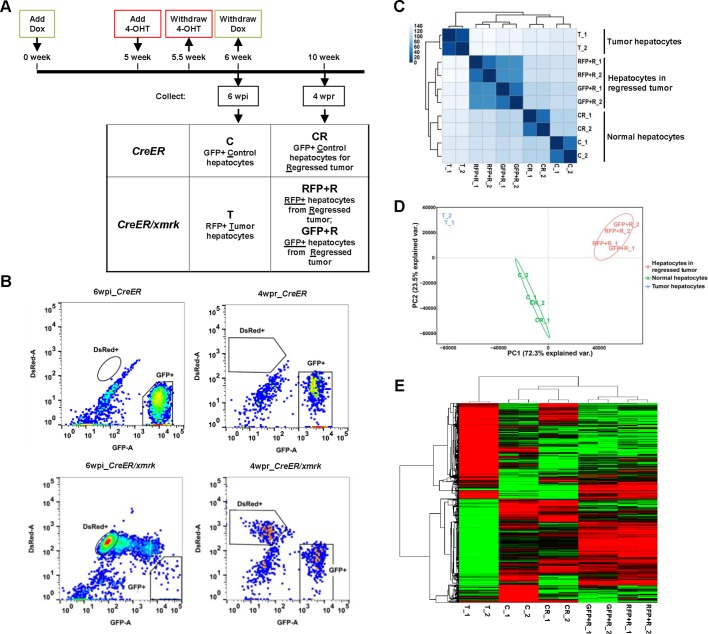
Fig. 4.
RNA-seq analyses of tumor-regressed hepatocytes. (A) Flowchart of fish treatment and sample collection. CreER and CreER/xmrk adult fish (4 mpf) were treated with Dox for 6 weeks to induce HCC. 4-OHT was added in the last week for 3 days to label tumor cells into RFP+. Livers were dissected at the tumor stage at 6 wpi and at the regression stage at 4 wpr, and subjected to cell sorting for: GFP+ normal hepatocytes from control CreER fish at 6 wpi (‘C’) and 4 wpr (‘CR’), RFP+ tumor hepatocytes from CreER/xmrk fish at 6 wpi (‘T’), and RFP+ and GFP+ hepatocytes from the regressed tumor of CreER/xmrk fish at 4 wpr (‘RFP+R’ and ‘GFP+R’, respectively). (B) FACS profiles of liver cells. Fluorescent-protein-labeled hepatocytes are boxed in each profile. (C) Correlation matrix heatmap showing the Euclidean distance between samples, which was generated using all the expressed genes. Darker color indicates stronger correlation. (D) Principal component analysis (PCA) of gene expression. (E) Hierarchical clustering and heatmap of the differentially expressed genes in various hepatocytes. Gene expression (FPKM) was log2-transformed and median-centered across genes.

