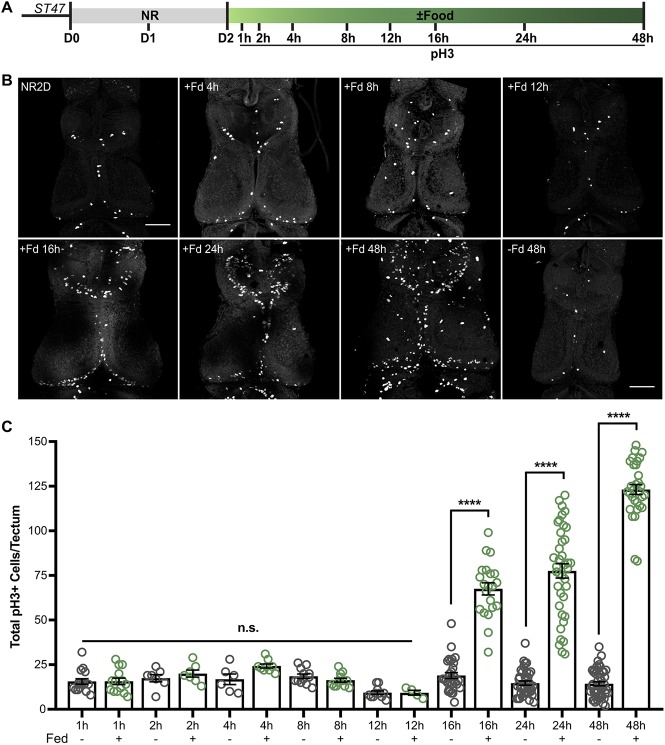
Fig. 2.
Nutrient-induced increase in cell proliferation occurs 16 h after feeding. (A) Experimental timeline. Animals were nutrient restricted for 2 days at Stage 47 and then food was re-introduced. Animals were sacrificed and processed for pH3 immunolabeling at the indicated time points after feeding. (B) Whole-mount confocal images of pH3 immunofluorescence in the optic tectum at the time points indicated. Fd, food. (C) Quantification of pH3 labeling showing total cell counts per tectum at each time point (mean±s.e.m.). Green data points indicate fed and gray are NR animals. At 16 h after feeding, pH3+ cells are significantly increased compared with NR controls, ****P<0.0001. n.s., not significant. n=6-47 animals per group per time point, from multiple independent clutches, for a total of 304 animals, across 16 groups from multiple independent clutches; see Table S1. Scale bars: 100 μm.

