Fig. 7.
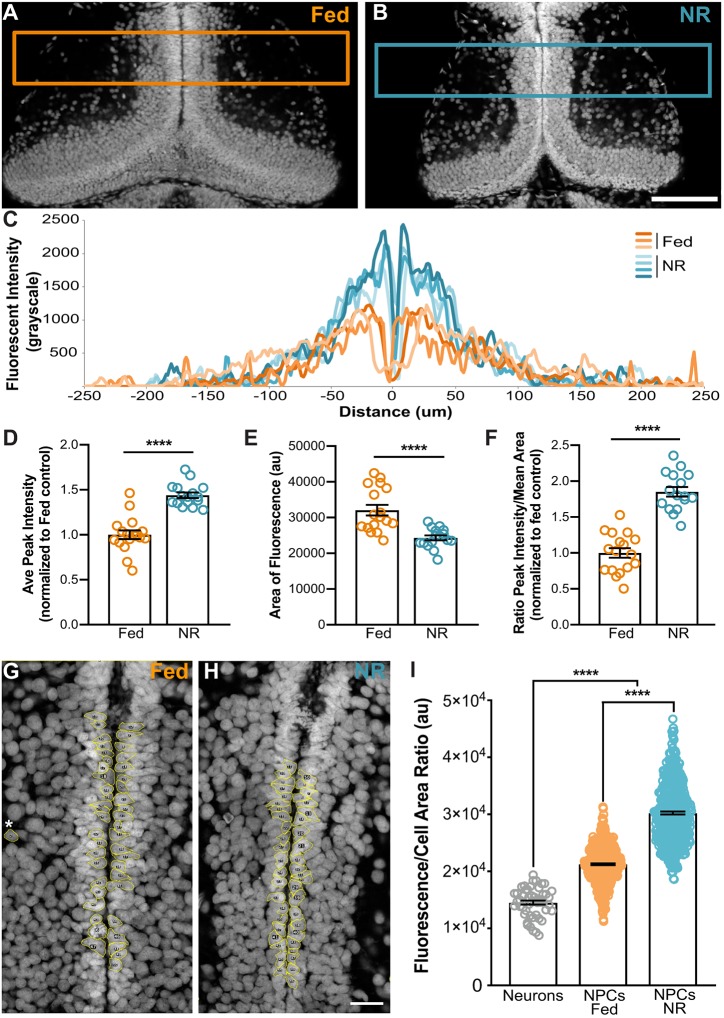
Nutrient restriction increases DNA content in NPCs. (A-F) Whole tectum fluorescence intensity analysis. Brains from continuously fed (orange, A) and nutrient-restricted (blue, B) animals were stained with TOPRO-3 to label DNA. Boxes in A and B indicate the area analyzed by line scan. (C) Example of averaged line scans from four individual nutrient-restricted (blue) and three individual fed (orange) animals showing a higher peak of DNA labeling along the midline in the NR brains. (D) Average peak intensity measurements demonstrate increased fluorescence in the NR brains, consistent with increased DNA content. (E) Average area of TOPRO-3 labeling, indicating that there are more cells in the fed animals. (F) Fluorescent Index (ratio of peak intensity/area) indicates that DNA content is significantly greater in the tectal proliferative layer of nutrient-restricted animals than in fed animals. (G-I) Single cell fluorescent intensity analysis. Cell tracing of progenitor cells along the midline in fed (G) and nutrient-restricted (H) animals. Individually traced cells are outlined in yellow. Asterisk indicates an example neuronal cell body adjacent to the neuropil that was traced for baseline 2N DNA content. (I) Fluorescence/cell area ratio indicates that DNA content is higher in the progenitor population than in neurons (gray), and DNA content is further increased in NR-NPCs (blue) compared with fed NPCs (orange). For A-F, n=16-17 animals per group for a total of 33 animals from 2 independent clutches. For G-I, n=10 animals per group (50 cells per animal) for a total of 500 cells measured per condition. See Table S1 and Materials and Methods. ****P<0.0001. Scale bars: 100 μm (A,B); 20 μm (G,H).

