Fig. 2.
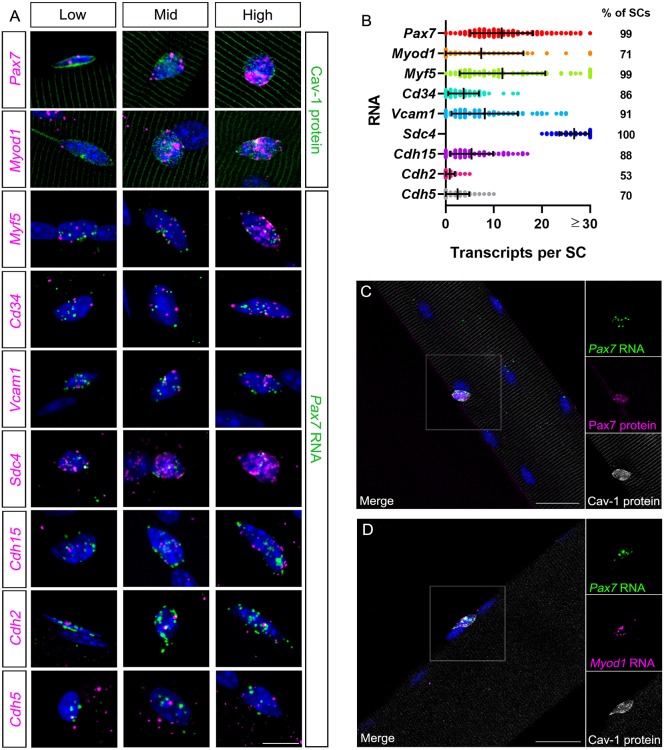
MF-RNAscope can be used alone or in combination with IF to evaluate and quantify SC heterogeneity. (A) MF-RNAscope or MF-RNAscope/IF of SCs on myofibers probed for (top to bottom, in magenta): Pax7, Myod1, Myf5, Cd34, Vcam1, Sdc4, Cdh15, Cdh2 and Cdh5 RNAs. All SCs were identified through a multiplexed SC marker (green), either Cav1 protein (top two rows) or Pax7 RNA (remaining rows). Each row contains SCs with low, mid and high levels of the given RNAs. (B) Quantification of transcripts per SC; right column indicates the percentage of SCs with ≥1 visible transcript. The numbers of individual puncta are listed as transcripts. Data are mean±s.d. n=225 (Pax7), 73 (Myod1), 93 (Myf5), 83 (Cd34), 80 (Vcam1), 76 (Sdc4), 91 (Cdh15), 91 (Cdh2) and 84 (Cdh5) SCs from ≥3 mice each. (C,D) MF-RNAscope/IF of SCs: Pax7 RNA (green), Pax7 (magenta) and Cav1 (white) proteins (C); Pax7 (green) and MyoD (magenta) RNAs and Cav1 protein (white) (D). Note that the Cav1 antibody interacts non-specifically and variably with sarcomeres. Nuclei are identified with DAPI (blue). Insets (right) show magnification of boxed area. Scale bars: 10 µm in A; 25 µm in C,D.

