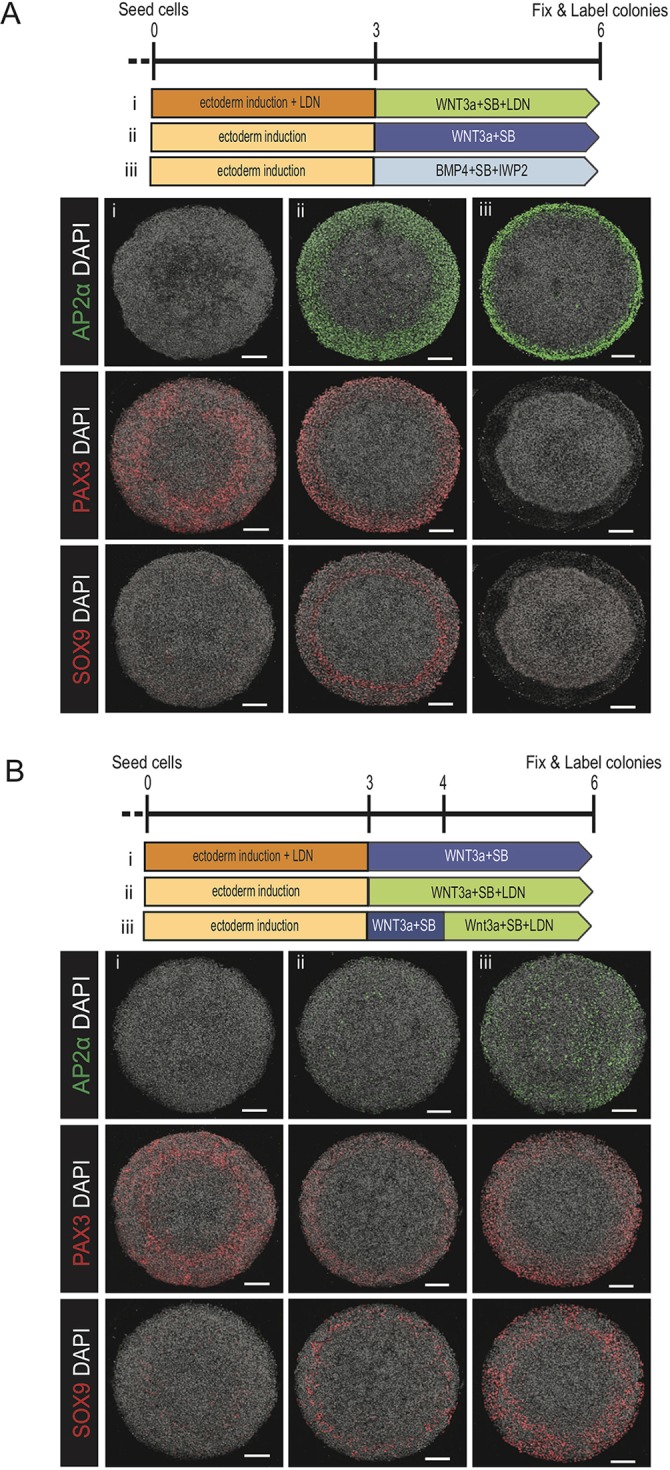
Fig. 7.

Dissecting the logic connecting BMP and WNT signaling to the transcription factors AP2a, PAX3 and SOX9. (A,B) Representative images of colonies immunostained for AP2α, PAX3 or SOX9. The induction schematic indicates the signaling conditions over the course of the experiment. In A: (i) 3 days SB+LDN followed by 3 days WNT3a+SB+LDN; (ii) 3 days SB followed by 3 days WNT3a+SB; (iii) 3 days SB followed by 3 days BMP4+SB+IWP2. In B: (i) 3 days SB+LDN followed by 3 days WNT3a+SB; (ii) 3 days SB followed by 3 days WNT3a+SB+LDN; (iii) 3 days SB followed by 1 day WNT3a+SB then 2 days WNT3a+LDN+SB. Each experiment was replicated three times. Colony diameter: 700 µm. Scale bars: 100 µm.
