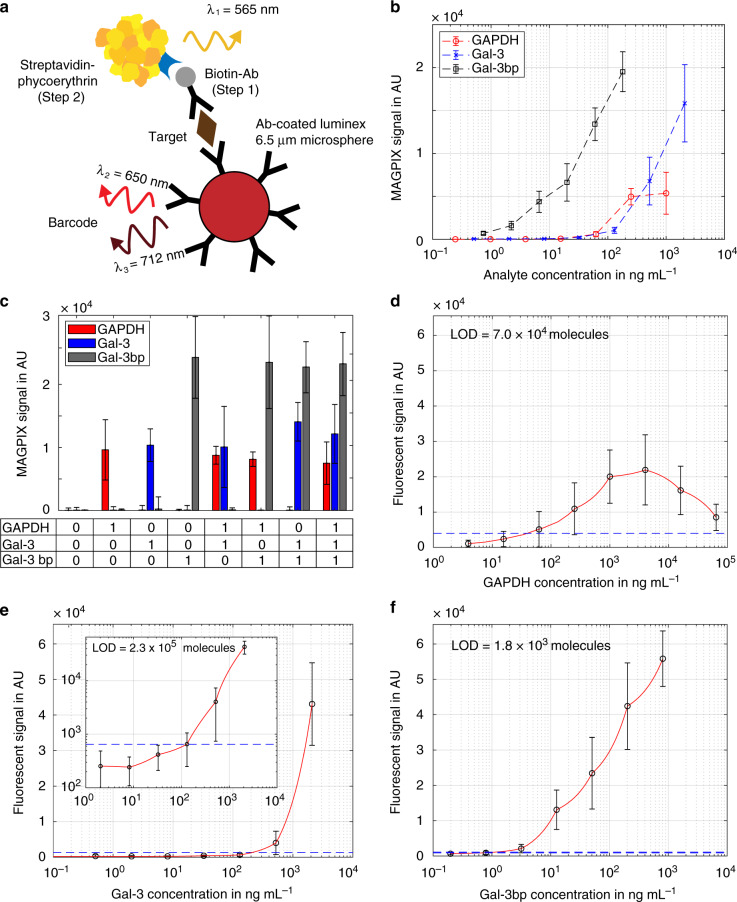
Fig. 4. Immunoassays with barcoded Luminex beads.
a Schematic illustration of the immunoassay on the bead surface. Labelling was conducted in two steps with biotinylated antibodies (step 1) and streptavidin-conjugated Phycoerythrin (step 2). (b) Calibration of GAPDH, Gal-3 and Gal-3bp in a 96-well plate format. c Multiplexing with all three targets revealed that there was no cross-reaction between the assays. The digital combinations of the three targets are noted underneath the table, with (“1”) indicating the presence and (“0”) indication the absence of the analyte (d–f). On-chip calibration curves in microchambers with the respective limits of detection (LODs). The blue dotted lines represent the corresponding background signals plus three times the standard deviation. The red lines represent the linear interpolation fit (please note the semi-logarithmic x-axis scaling that results in the nonlinear appearance of the linear interpolation curves)

