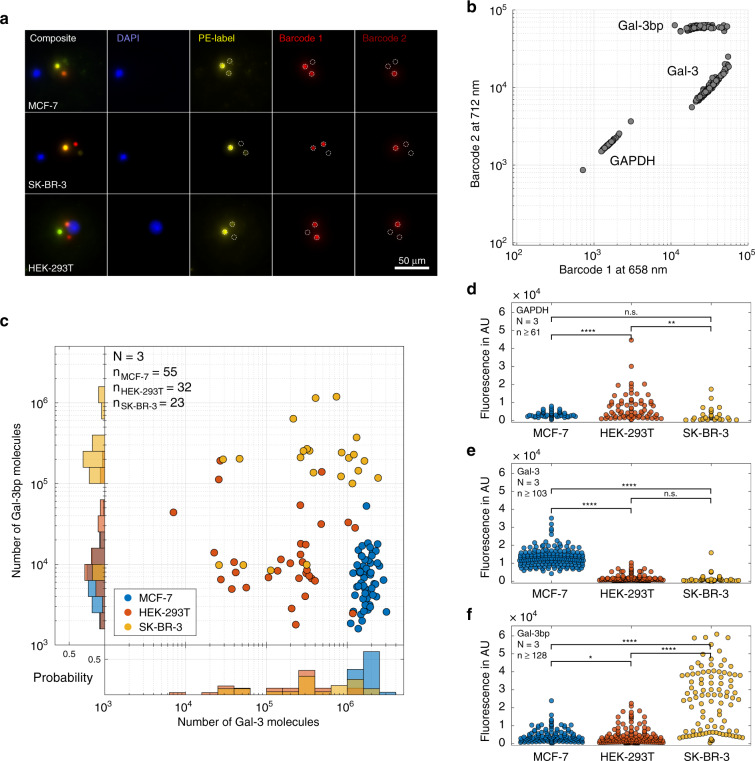
Fig. 5. Multiplexed single-cell analysis.
a Fluorescent images of selected microchambers that show the acquired images prior to analysis. Cells were visualized by staining of the nuclei, while the barcoded beads were identified by the ratio of emission at 658 and 712 nm. b Based on the fluorescent signals of the two barcoded labels, the bead identity could be determined. c Profiles of Gal-3 and Gal-3bp in the three investigated cell types (depicted in different colours). The data were derived from microchambers in which both types of functionalized beads (Gal-3 and Gal-3bp) were co-immobilized with one individual cell. With few exceptions, each cell type exhibited a clear expression pattern for the two proteins. d–f Fluorescence signals derived from the functionalized beads for all tested cells. Here, we used microchambers in which at least one type of barcoded bead was co-captured. While SK-BR-3 cells expressed higher Gal-3bp levels than HEK-293T and MCF-7 cells, the latter showed stronger Gal-3 expression when compared with HEK-293T and SK-BR-3 cells. For GAPDH (d), we observed an effect similar to the high-dose Hook effect, resulting in a signal decrease at increasing target concentrations (Fig. 4d). Hence, HEK-293T cells, which showed the highest fluorescence in the GAPDH assay, actually had lower GAPDH concentrations than the other two cell lines; significance levels are indicated with n.s. P > 0.05, *P ≤ 0.05, **P ≤ 0.01, ***P ≤ 0.001 and ****P ≤ 0.0001

