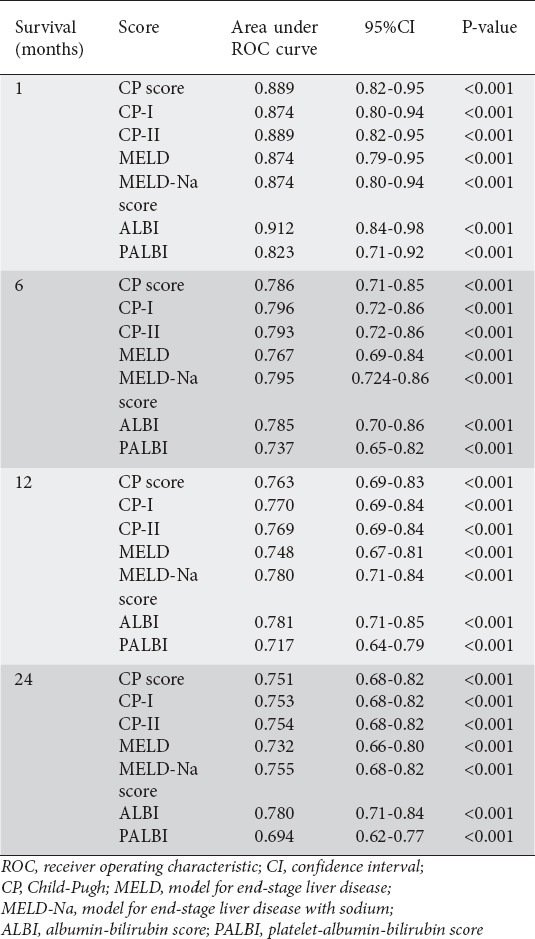
Table 2.
Comparisons of the areas under the ROC curve for CP, CP.I, CP.II, MELD, MELD.Na, ALBI and PALBI scores in relation to 1., 6., 12., and 24.month survival

Comparisons of the areas under the ROC curve for CP, CP.I, CP.II, MELD, MELD.Na, ALBI and PALBI scores in relation to 1., 6., 12., and 24.month survival
