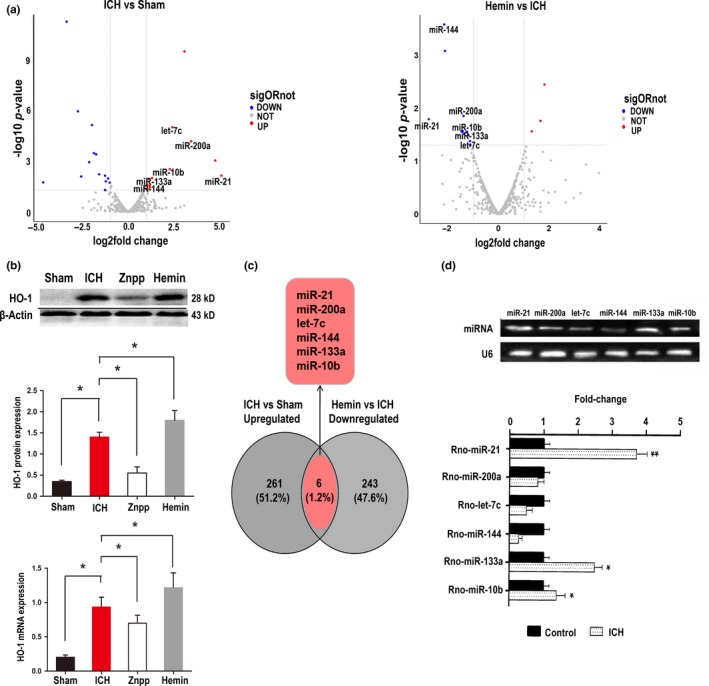
Figure 1.

Expression profiles of miRNAs upon HO‐1 activation. (a) The Volcano plot compiled differentially expressed miRNAs between the two groups (ICH vs. Sham and haemin vs. ICH). The red dots indicate upregulated miRNAs, and the blue dots indicate downregulated miRNAs (p < 0.05). (b) HO‐1 mRNA and protein level modulation via haemin and ZnPP treatment in ICH‐model rats was confirmed by Western blot and PCR. Data are the means ± SEM for 3 independent experiments. *p < 0.05. (c) Venn diagram of miRNAs expressed in two groups as determined by microarray sequencing, differentially expressed miRNAs that downregulated ICH versus haemin merged with upregulated ICH versus sham = 6. (d) For each miRNA candidate, qRT–PCR measurements were performed to obtain a mean CT value for each sample. CT values of the different samples were compared using the 2−ΔΔCT method with U6 expression levels used as an internal reference. All results are presented as the means ± SEM of three independent experiments. *p < 0.05, upregulation versus control
