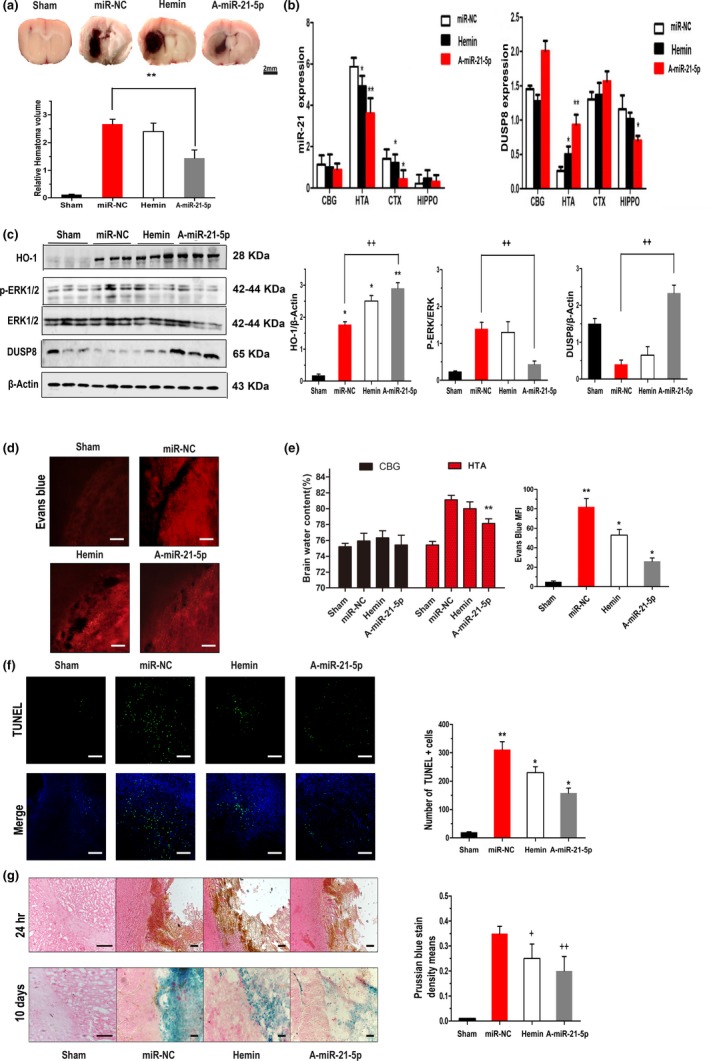
Figure 3.

Inhibition of miR‐21‐5p alleviates haemorrhagic injury. (a) Representative ICH brain section images and quantitative data on lesion volumes at 24 hr post‐ICH with different dispositions. Scale bar = 2 mm. The bar graph shows the volumes of total haematoma in the ipsilateral hemisphere normalized to the total volumes of the contralateral hemisphere. Data are the means ± SEM of six rats per group. **p < 0.01. (b) Modulation of miR‐21 and DUSP8 mRNA levels was confirmed by qRT–PCR between different brain areas (CBG: contralateral basal ganglia; HTA: haematoma; CTX: cerebral cortex; HIPPO: hippocampus) 24 hr post‐ICH. Data are the means ± SEM of 3 independent experiments for all 4 parameters. *p < 0.05 by Student's t test. (c) Levels of HO‐1, DUSP8, p‐ERK and ERK in perihaematomal tissues of ICH rats were determined by Western blot 24 hr after ICH. β‐actin served as an internal control. (d) Evans blue (EB) extravasation 24 hr post‐ICH. Scale bar = 100 μm. (e) Brain water content of rats 24 hr post‐ICH (CBG: contralateral basal ganglia; HTA: haematoma). (f) TUNEL staining of apoptotic cells in the brain sections. The representative images of perihaematomal areas are presented. Scale bars, 100 μm. Bar graph shows the number of TUNEL + cells in four groups. **p < 0.01 versus sham group. *p < 0.05 versus miR‐NC group. (g) Prussian blue‐stained section (counterstained with haematoxylin and eosin) shows the location of iron deposits in the perilesional areas on postoperative day 10. Scale bar = 100 m, four groups share scale bars. ++p < 0.01 versus miR‐NC group. +p < 0.05 versus miR‐NC group
