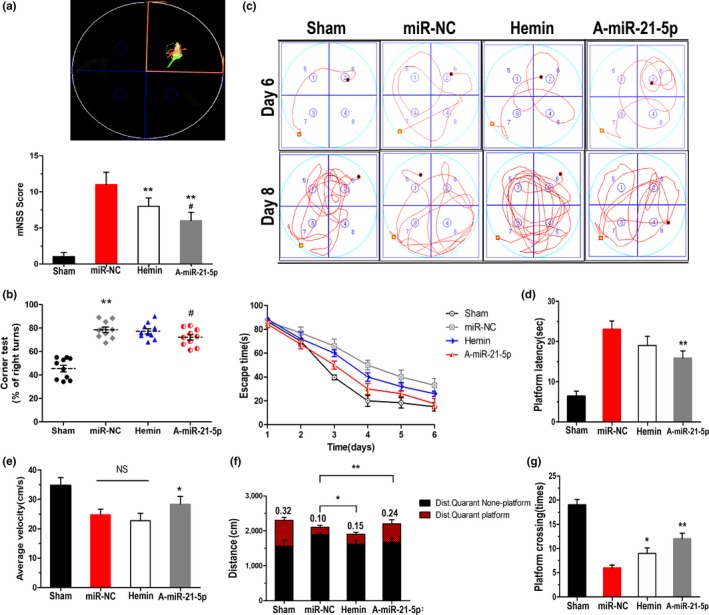
Figure 4.

Inhibition of miR‐21‐5p restores neurological functions. (a,b) The mNSS (a) and corner test (b) were assessed 24 hr post‐ICH to assess neurological deficits in rats. For hidden platform training, the line graph (c) shows the escape time to find the hidden platform. The bar graph (d) shows the platform latency to reach the hidden platform. For the probe trial test, the bar graph shows (f) the ratio of distance spent in the target quadrant platform to total distance, the time spent crossing the platform (g) and the average velocity (e) of the four groups. Data represent the means ± SEM of 15 rats per group. *p < 0.05 by Student's t test
