Figure 4.

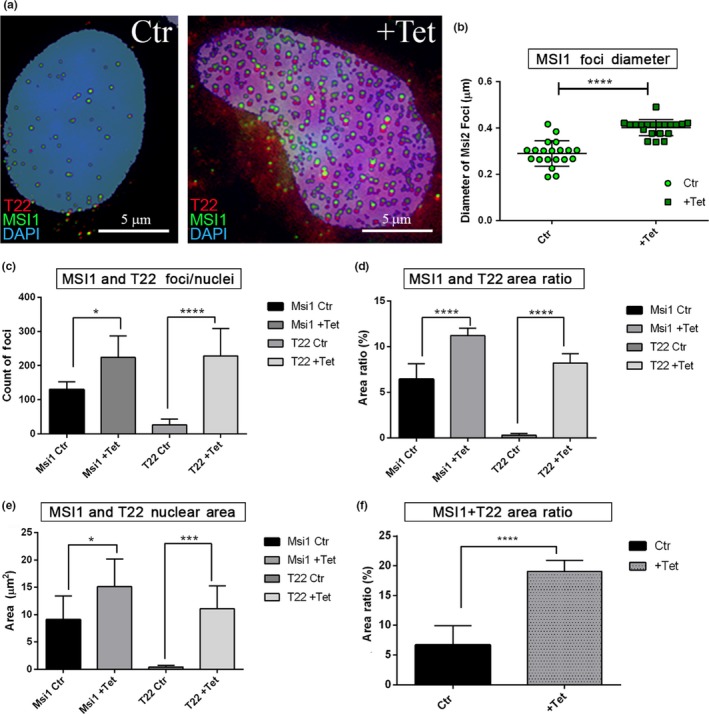
Increment of MSI1 and T22 nuclear foci in P301L tau iHEK. (a) Representative confocal images of control and +Tet nuclei stained with MSI1 (green), T22 (red), and DAPI (blue). Images are obtained after double extraction analysis to quantify their number, area ratio (%), area (µm2), and total area ratio. In the confocal images, we can observe the increment of MSI1 and T22 foci in the nucleus after the mutant tau overexpression. Rounded foci look to be the most representative forms observed. (b) The diameter of MSI1 foci has been measured and represented in a dot plot showing a significant increment of the diameter after treatment with Tet (****p < .0001). (c) Increment of number per nuclei of MSI1 (*p = .0440) and T22 (****p < .0001) foci has been observed as well as significant increment of area ratio of MSI1 (****p < .0001) and T22 (****p < .0001) shown in (d). (e) The same trend has been observed in the area covered by MSI (*p = .0368) and T22 (***p = .0003). (f) Increment of coupled signals has been showed with the sum of MSI1 and T22 signal area ratio (from 6.70 ± 3.2% to 19.04 ± 1.86%, ****p < .0001)
