Figure 9.

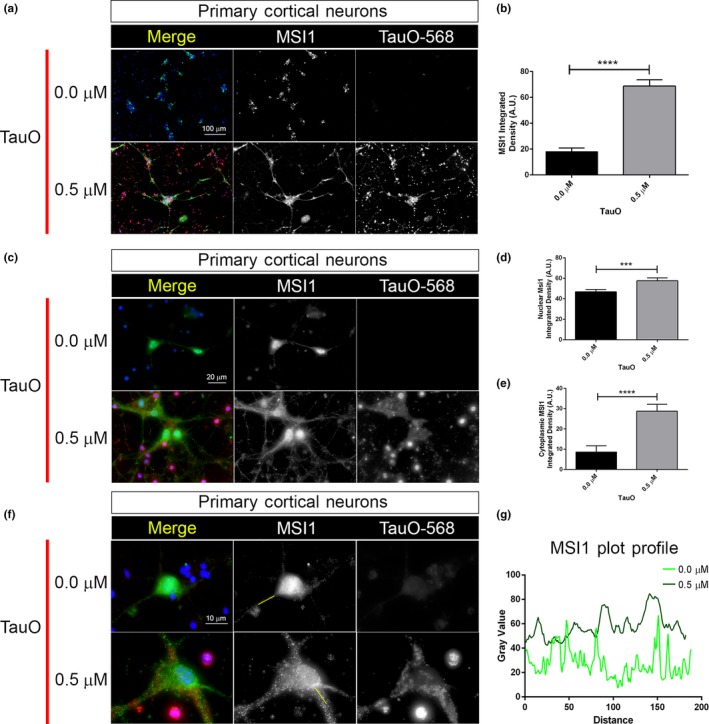
Tau oligomers affect MSI1 cellular localization and accumulation in primary neurons. (a) Representative confocal images of untreated and treated (0.5 µM tauO) primary cortical neurons. Images are represented by merge, MSI1 (green channel) and tauO‐568 (red channel); both channels are represented in gray for a better contrast (magnification: 20×, white scale bar: 100 µm). (b) MSI1 integrated density quantification in untreated and tauO‐treated neurons (****p < .0001). (c) Representative confocal images of untreated and treated (0.5 µM tauO) primary cortical neurons. Images are represented by merge, MSI1 (green channel) and tauO‐568 (red channel); both channels are represented in gray (magnification: 100×, white scale bar: 20 µm). (d–e) MSI1 integrated density quantification, respectively, in nuclei and cytoplasm (0.0 µM vs. 0.5 µM, ***p = .0002 and ****p < .0001, respectively). (f) Representative confocal images of untreated and treated (0.5 µM tauO) primary cortical neurons. Images are represented by merge, MSI1 (green channel) and tauO‐568 (red channel); both channels are represented in gray (magnification: 100×, optical zoom: 3× white scale bar: 10 µm). (g) Intensity plot profiles from representative axonal MSI1 signals. Light green line represents untreated neurons segment, while dark green line represents tauO‐treated neurons segment. Represented segments are highlighted in solid green line in (f) MSI1 channel. Nuclei are with DAPI, and bar graph is used to show integrated density measurements (error bars represent SD)
