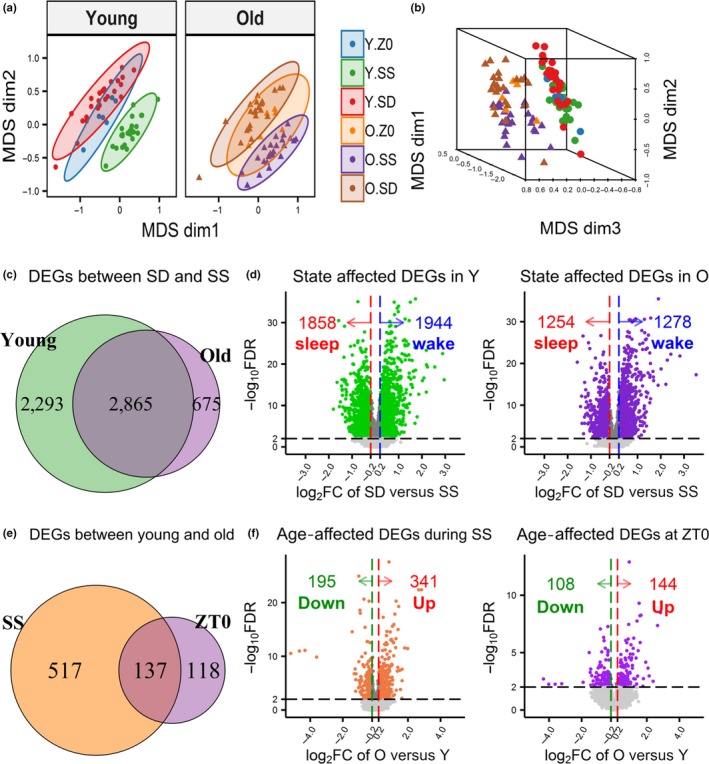
Figure 1.

Differentially expressed genes (DEGs) between spontaneous sleep (SS) and sleep deprivation (SD) or between young and old mice. (a) Two‐dimensional plots of the multidimensional scaling (MDS) results of the young (left) and old (right) samples show SS and SD samples formed separate clusters on the first two dimensions, demonstrating that behavioral state explains the largest proportion of gene expression variability. Mice collected at ZT0 formed their own clusters between the SS and SD. (b) Three‐dimensional plot of the MDS results shows young and old samples formed separate clusters on the third dimension, illustrating age explains a smaller proportion of variability. (c) Venn diagram of the DEGs identified between SD versus SS within the young and the old mice across time points (FDR < 1%) indicate nearly 50% of genes are common. (d) Volcano plots of the −log10 FDR value and the log2 fold change (FC) between SD and SS (averaged across time points) are shown for the young (left) and old (right). DEGs with absolute log2 FC < 0.2 were filtered. (e) Venn diagram of the DEGs (FDR < 1%) identified in comparisons of young and old mice during SS or at ZT0 (f) Volcano plots of the −log10 FDR value and the log2 FC between old and young are plotted for the SS (left; averaged across four time points) and ZT0 (right). DEGs with absolute log2 FC < 0.2 filtered
