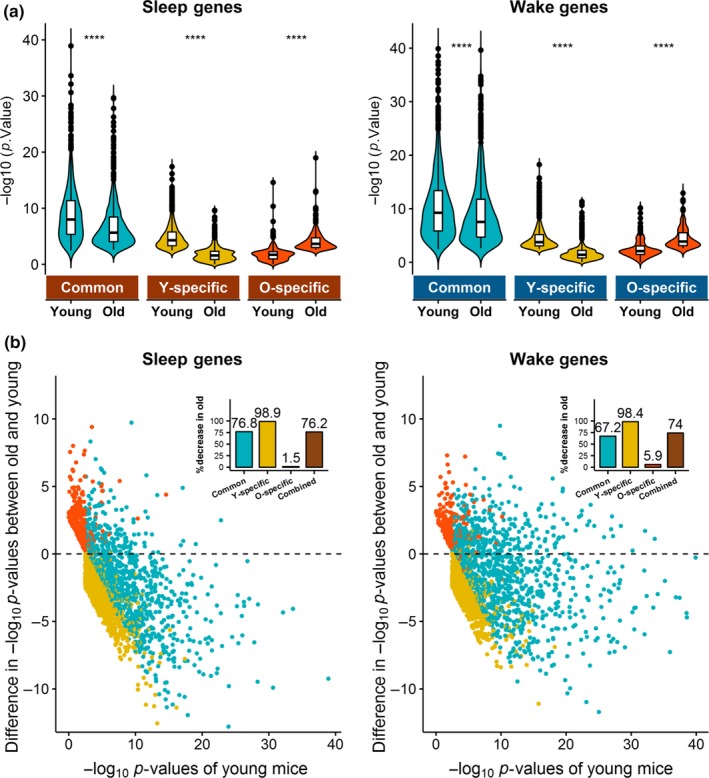
Figure 3.

Comparisons of p‐values and fold changes (FCs) of sleep and wake genes between old mice and young mice. (a) –log10 p from the SD versus SS contrast was compared between young and old mice for the common or age‐specific sleep (left) and wake (right) genes. Significantly decreased –log10 p were observed in old mice in both young‐specific and common genes, which represent 87.2% of the sleep genes and 90.5% of the wake genes tested. The remaining old‐specific genes had significantly increased –log10P in old mice compared to young. ****: p < 2e−16. (b) Scatter plots of the differences in absolute values of log2 FC of individual sleep (left) and wake (right) genes between old and young mice. Positive differences indicate greater FC in old, and negative differences indicate greater FC in young. Inset bar plots show the percentage of common and age‐specific genes with decreased FC in old. Over 98% of the young‐specific genes, 76.2% of common sleep genes, and 65.8% of common wake genes have decreased FC in old, whereas over 97% of old‐specific genes have increased FC in old. The small percentages of age‐specific genes showing increased significance in the opposite age‐group are likely due to the applied FC cutoff that allocates similarly significant genes into age‐specific groups. Overall, 76.0% of sleep genes and 73.1% of wake genes have reduced FC in old mice
