
Figure 5.
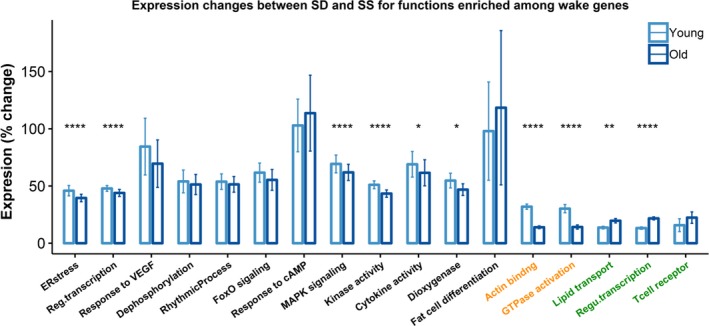
Relative expression changes (%) between SD and SS for genes involved in the functional clusters enriched among the wake genes. Mean expression changes of the genes in each function are compared between young (light blue) and old (dark blue) mice. Colors on the x‐axis indicate if the functions are enriched among the common (black), young‐specific (orange), or old‐specific (green) wake genes. *: p < .05; **: p < .01; ***: p < .001; ****: p < .0001