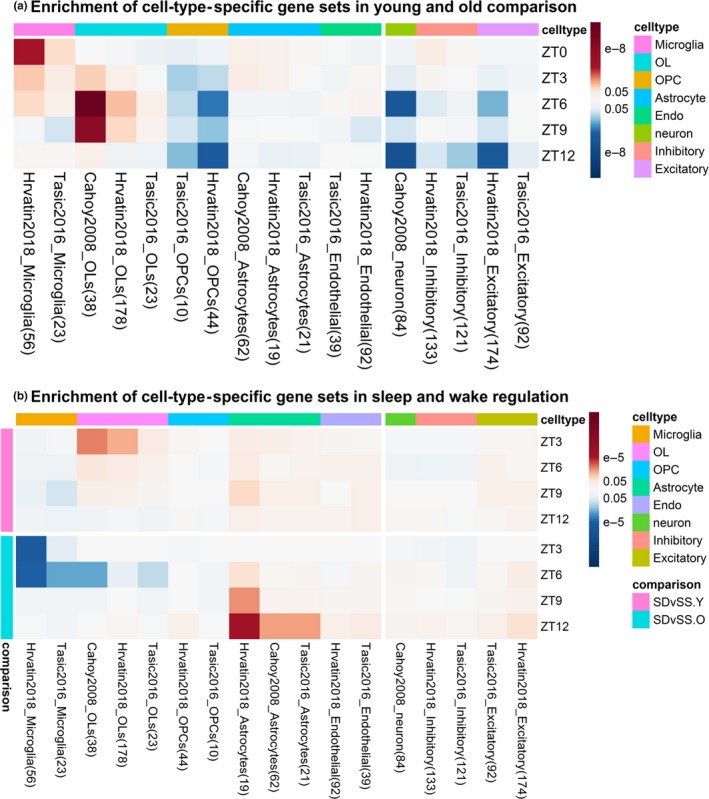
Figure 6.

Heat map of adjusted p‐values for enriched cell‐type‐specific gene sets. Columns are arranged by the cell types. OL = oligodendrocyte; OPC = oligodendrocyte precursor cell. Cell colors indicate upregulation (red) and downregulation (blue), either in old for age comparisons or in SD for SD vs SS comparisons. (a) Old versus young at ZT0 and during SS; (b) SD versus SS of the young and old mice across time points
