
Figure 4.
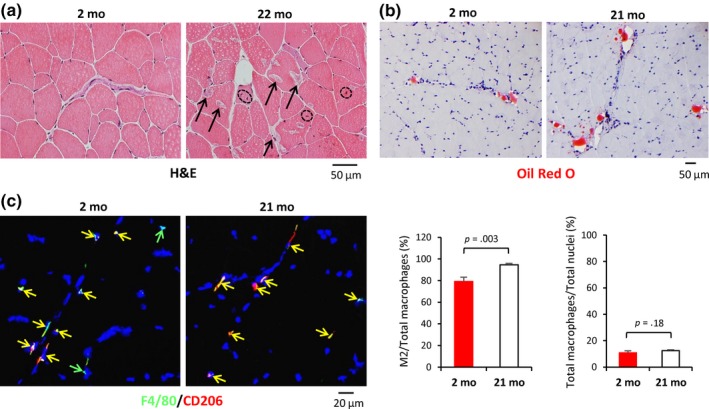
Increased intermuscular adipose tissue (IMAT) and M2 macrophages in aged skeletal muscle of BALB/c mice. (a) Histological analysis to visualize dystrophic muscle cells in old mice (arrows, right panel), but not in young mice. Notably, muscle fibers with centered nuclei were frequently observed in skeletal muscle from 22‐mo mice (broken circles) but not in 2‐mo mice. (b) Oil Red O staining was used to visualize IMAT in the perimysium of skeletal muscle (red) of 2‐ and 21‐mo mice. No obvious fat drops were observed in endomysium or intramuscle cells. (c) Left, Double immunostaining of F4/80 (green) and CD206 (red) to identify M2 macrophages in mouse SKM (left panels). Right, quantification of M2 and total macrophages in each age group