
Figure 5.
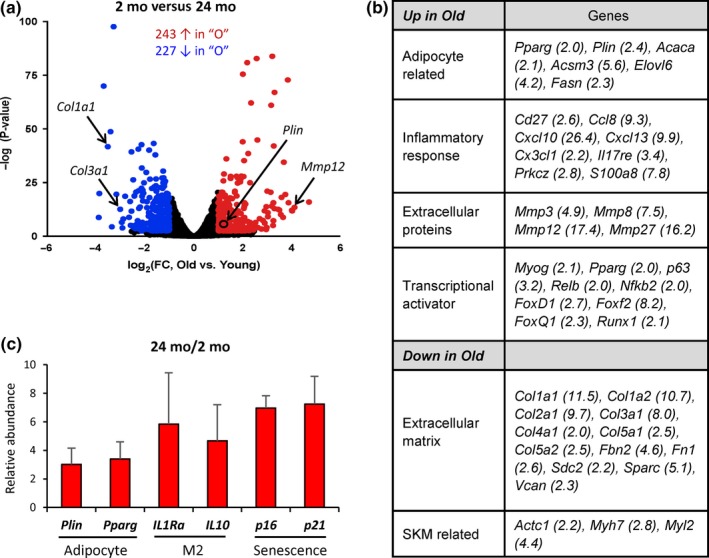
Elevated cytokines in aged mouse skeletal muscle. (a) Relative abundance of mRNAs in young (2 mo) and old (24 mo) mouse skeletal muscle, as assessed by microarray analysis. mRNAs displaying higher and lower abundance (>2‐fold, FDR < 0.05) are shown as red or blue dots, respectively. (b) GO enrichment analysis of clusters of mRNAs in muscle samples from 24‐mo versus 2‐mo mice. (c) RT‐qPCR analysis of adipocyte markers, anti‐inflammatory cytokines (M2), and senescent markers in old SKM