
Figure 1. RNF8 is a ubiquitinated substrate of p97 under physiological and genotoxic conditions.
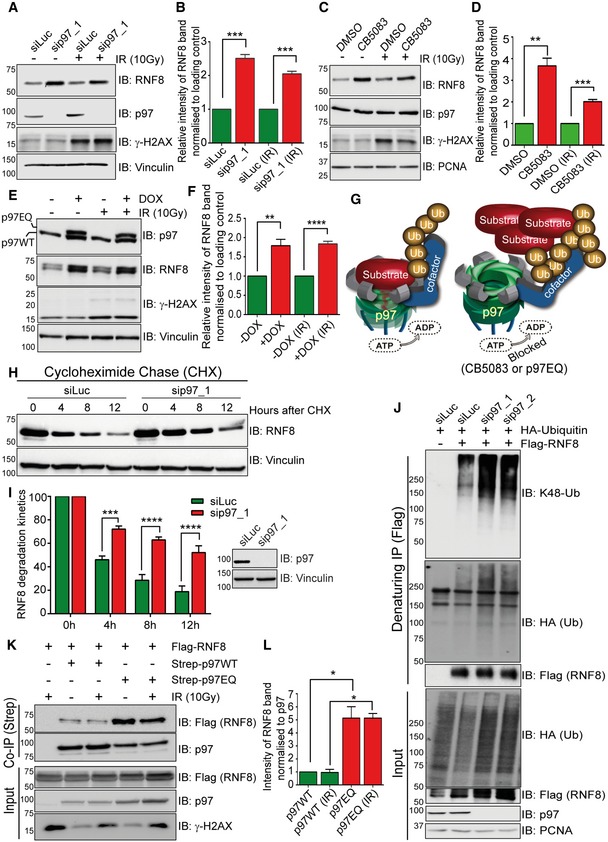
- Western blot analysis showing increased RNF8 protein level in HeLa cells after siRNA‐mediated p97 depletion under physiological conditions and after IR (10 Gy).
- Graph represents the quantifications of (A) (***P < 0.001; unpaired t‐test, n = 3, mean + SEM).
- Western blot analysis showing increased RNF8 protein level in HeLa cells after p97 chemical inhibition (CB5083, 10 μM for 6 h) under physiological conditions and after IR (10 Gy).
- Graph represents the quantifications of (C) (**P < 0.01, ***P < 0.001; unpaired t‐test, n = 3, mean + SEM).
- Western blot analysis showing increased RNF8 protein level in HEK293 cells after doxycycline‐inducible mild expression of the p97EQ variant under physiological conditions and after IR (10 Gy).
- Graph represents the quantifications of (E) (**P < 0.01, ****P < 0.0001; unpaired t‐test, n = 4, mean + SEM).
- Model representing the processing of ubiquitinated substrate by p97 ATPase activity. Inactivation of p97 ATPase activity leads to the accumulation of ubiquitinated substrate.
- Western blot analysis of CHX chase kinetics showing reduced RNF8 degradation rate in HEK293 cells after siRNA‐mediated p97 depletion.
- Graph represents the quantifications of (H) (***P < 0.001, ****P < 0.0001; two‐way ANOVA, n = 3, mean + SEM) and Western blot for efficacy of siRNA depletion of p97 (right).
- Western blot analysis of Flag‐RNF8 denaturing‐IP in HEK293 cells showing K48‐linked hyper‐ubiquitination of RNF8 after siRNA‐mediated p97 depletion.
- Western blot analysis of Strep‐p97 Co‐IP in HEK293 cells showing increased RNF8 interaction with p97EQ variant as compared to p97‐WT under physiological conditions and after IR (10 Gy).
- Graph represents the quantifications of (K) (*P < 0.05; unpaired t‐test, n = 2, mean + SEM).
Source data are available online for this figure.