
Figure EV3. ATX3 operates downstream of RNF8 and K63‐Ub at sites of DNA damage.
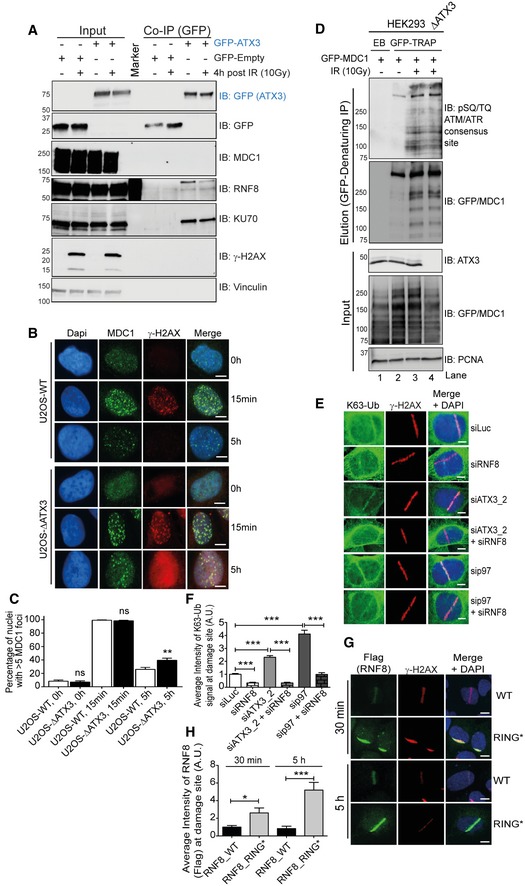
- Western blot analysis of GFP‐ATX3 Co‐IP in HEK293 cells showing interaction of ATX3 with endogenous RNF8 but not with MDC1 under physiological conditions and after IR (10 Gy).
- Representative IF images showing kinetics of endogenous MDC1 foci after 2 Gy of IR treatment in U2OS‐WT and U2OS‐∆ATX3 cells (scale bar: 10 μm).
- Quantification of (B). Graph representing percentage of nuclei with > 5 MDC1 foci, measured in more than 100 cells per condition per experiment (ns P > 0.05, **P < 0.01; unpaired t‐test, n = 2, mean + SEM).
- Western blot analysis of EGFP‐MDC1 denaturing‐IP showing phospho‐MDC1 (pSQ/TQ‐MDC1; RNF8 recruitment motif) signal in HEK293 and HEK293∆ATX3 cells after 10 Gy of IR treatment.
- Representative IF images showing the UV‐A micro‐laser‐induced DNA damage tracks in U2OS cells. Endogenous K63‐Ub and γ‐H2AX signal at damage tracks under indicated siRNA‐depleted conditions. Scale bar: 10 μm.
- Quantification of (E). Graph represents the average intensity of K63‐Ub (***P < 0.001; unpaired t‐test, n = 3, mean + SEM, at least 100 nuclei per condition and experiment).
- Representative IF images showing Flag‐RNF8‐WT or Flag‐RNF8‐RING* variant signal at UV‐A micro‐laser‐induced DNA damage tracks in U2OS cells after 30 min and 5 h of damage induction. Scale bar: 10 μm.
- Quantification of (G). Graph represents the average intensity of the RNF8 signal (*P < 0.01, ***P < 0.001; unpaired t‐test, n = 2, mean + SEM, at least 50 nuclei per condition and experiment).
Source data are available online for this figure.